By Yannan Sun and Mark Carpenter, Oncor Electric Delivery, USA
After the foundational implementation of an Advanced Metering System (AMS), a Distribution Outage Management System (OMS), a Mobile Work Management System (MWMS) and their integrations with each other and with various customer systems, the operation of Oncor Electric Delivery’s distribution system transformed from a reactive outage driven system to a sophisticated interactive computer and data driven system. The large amount of data collected by over 3.9 million AMS meters and 6,000 distribution Supervisory Control and Data Acquisition (SCADA) devices enabled our capability to develop many situational awareness and decision-making support tools for proactive maintenance, preparation for high-load seasons, and real-time operations.
As more measurement data and data-driven algorithms become available, AI adoption plays an essential role in increasing operational efficiency, and meeting and exceeding customer expectations, especially during outage restoration efforts. This article gives an overview of Oncor’s efforts on creating operational and computing systems to make advanced data analytics possible. Several use cases with high maturity and high business value will be presented to illustrate how data analytics has been impacting distribution operations at Oncor.
Core Operational Systems
Between 2008 and 2012, Oncor completed the implementation of several major systems – AMS, OMS, and MWMS. The built-in interactions between these systems as well as their integrations with transmission and distribution SCADA systems brought significant ‘artificial intelligence’ into our daily operations. For the AMS, in addition to the 15-minute revenue quality kWh consumption data and voltage readings, the advanced meters also provide outage and restoration signals, and configurable voltage perturbation signals.
The AMS sends outage messages directly to the OMS just as if a customer called in for an outage. Since there is no dependency on customer call time, these outages can be quickly analyzed using OMS’s inferencing logic and the level of the outage is quickly known. After a ticket is automatically created by the OMS, the operators dispatch field personnel to troubleshoot and address the ticket.
The MWMS is used to capture field activities and sends updates to the OMS. Over the last several years, these systems were tightly integrated with the Customer Information System (CIS) and Maximo asset management system. Currently customers can receive notifications and report issues in various ways.
It is vital to Oncor’s strategy that these core transactional operational systems use commercially-off-the-shelf (COTS) software products. However, many user interfaces are home-grown through the use of Application Programing Interfaces (APIs). In addition, many analytical programs are developed for a large variety of functions across the company. New analytical programs continue to be developed and existing ones enhance, for both real-time and after-the-fact applications.
Analytics Platform
The largest source of information is the AMS data, which includes 15-minute energy usage and average voltage that are pushed from the meters every four hours. It also includes various signals from the meters of abnormal conditions that are transmitted as they occur.
The value of this dataset is maximized when it’s linked to other data such as SCADA data, geospatial data, outage data, work order information, system maintenance information, and weather data.
In many industry use-cases, the methods currently used may appear simplistic compared to the latest research; however, these use-cases are of high value, and large amounts of data are readily available. Since we have multiple databases for various systems, an essential challenge for conducting any big data analysis is to unify this data and enforce consistent formats for each data type.
To grow our data analytics capability, Oncor created an Oracle-based datalake to consolidate the data needed for analytics. The datalake replicates data from all of Oncor’s operational databases. In addition to supporting uniformity, this approach also minimizes stress on operational databases because they are accessed only during each scheduled copy rather than whenever an analyst makes a query. Presently this large datalake contains 160TB of data. A number of tools are integrated with the analytics platform for data processing, analytics, and visualization. This analytics platform also incorporates a Data Science Laboratory (referred to as the Sandbox) where Data Scientists and other analytics employees can develop and test algorithms and solutions. Most users are allocated 1GB for their sandbox use; however, the more advanced users are allocated larger space, up to 400 GB. Each user develops their use cases in the Sandbox space for reporting or gaining insights. After the functionality of the algorithm is proven and refined, a fully developed program that is to be periodically or continually run will be productionized. Database specialists in the IT group streamline the program to fit the database structure so it runs very efficiently.
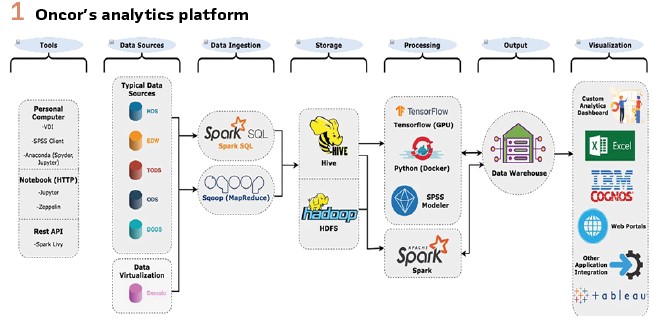
For heavy data processing and computing needs, Oncor uses big data management platforms that were developed to accommodate multimodal data storage and processing of unstructured heterogeneous data. Hadoop and Spark are two representative open-source designs for distributed data management. Hadoop is able to process massive heterogeneous data efficiently and economically by taking advantage of a programming model, a distributed file system, and a distributed data storage system. Spark, on the other hand, leverages the technology of resilient distributed datasets, which is more suitable for recursive computational operations in machine learning-based applications. Through data ingestion processes, necessary data is reformatted and replicated into the Hadoop Distributed File System (HDFS) so that the analysis can be done using the computing engine Spark. Figure 1 shows an overview of the analytics platform.
Organizational Approach to Analytics
One of Oncor’s strategic advantages is that we operate analytics as a federated organization rather than centralizing the analytics in a single area of the company. Governance and overall data base management is done by the centralize IT group. Actual use cases and tool development is generally created by data analysts and data scientists that are imbedded in various functional groups throughout the different business units.
At present, 388 people in the company have been trained with the analytical tools and have access to various data sources to support their individual efforts. 90 advanced users have space allocated so they can generate new data sources for the rest of the users.
About 10 of these people are considered “super users,” who are leading the effort to process our largest datasets for different business needs. They are also the thought leaders in Oncor’s analytics community to train analysts, drive innovation and reduce duplicate efforts through knowledge exchange. One of Oncor’s most significant advantages with this structure is that the use cases and tools developed are meeting specific requirements and desires from front line workers in the different business functions.
Analytics for Real-Time Situational Awareness
By pulling data from these core systems and other corporate systems, Oncor is able to provide near real-time operational information to system operators and others in the organization. Because the portals and dashboards are developed and managed internally instead of vendor dependent, it is cost effective to modify them or add functionalities for various business needs. For example, the Distribution Management System Portal is a home-grown system that tracks all current and recent outage events. The information is organized and accessible in multiple ways and provides a macro as well as a micro view of the situation at any point in time. The users can see details of troubleshooting comments, work order information, chronology of restoration efforts, and information of impacted customers. During major storms, the portal will activate a storm dashboard to display progress of storm restoration and all the historic information about how the storm outages are managed.
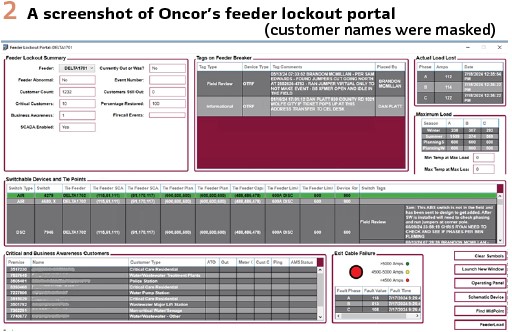
Another operator-initiated tool is the Feeder Lockout Portal as shown in Figure 2. This portal brings in all of the information that an operator would want to know any time a feeder breaker locks out due to a fault. This portal provides an immediate situational awareness where the operator will immediately know the load before the fault, yesterday’s average load and maximum load, the load carrying capability of all tie points, and other feeder specific attributes. This portal can be activated easily by the operator when an alert occurs.
After winter storm Uri in 2021, we developed a Load Shed Dashboard to address challenges in these events that have low probability but high impact. The dashboard shows all the information across multiple systems that are needed for decision making during system emergency situations: external system information such as ERCOT’s grid condition charts, real time load shed information such as feeder status, historic load trend charts, and SCADA/feeder availability. With this dashboard, operational decisions during training were made hours earlier than what was experienced without this aggregated information during the Uri event.
Other examples of situational awareness enhancements include:
1. Providing fault current levels at each switching device: Until the advanced system is capable of predicting fault location through algorithms, Oncor provides the fault current magnitudes at each switching device on the distribution feeder for feeders where microprocessor relays can provide the fault magnitude. This enables the distribution operator to more effectively isolate sections of the feeder to expedite restoration
2. Providing feeder loading information vs temperature: By knowing the amount of load on a feeder based on historic temperature, the operator can do planned outages with a higher level of surety. Figure 3 gives an example of the graphs that are being used. This tool is also able to display the combined information for two feeders that can be tied together, which provides in-sights for the operators when switching decisions need to be made
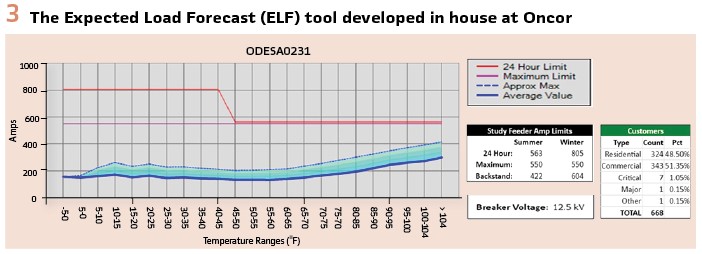
3. Providing loading information between each switching device based on temperature using AMS data: This data is important for distribution planners, operators when doing scheduled switching, and operators when doing emergency switching. Historically, load on sections of a feeder was usually a crude guestimate that was based on monthly usage and customer’s profiled usage
4. Providing distribution facility damage estimates based on weather forecast and backcast by service area: This big data analytics project predicts the amount of damage in an area based on the weather and season. It is used in a forecast fashion to estimate the damage a storm will cause (wire down, cross arms, poles, tree issues, etc.). It is also used in a backcast fashion to estimate the damage after a storm passes an area. Presently the fidelity is at a service center level. Over time we expect to collect enough historic data to adequately train the model to be able to predict the damage at a zip code level.
A key factor for real-time situational awareness and Oncor’s success is the ability to have large-scale customer interactions in real time. Communicating with customers in a manner in which they want to be communicated with is vital to customer satisfaction. Customers can report outages via voice communications, text, in the mobile app, or through the Web. They can also choose to receive outage notifications and restoration messages via text.
Oncor presently uses a table-based approach to predict the Estimated Time of Restoration (ETOR) to communicate to customers. We have been putting significant effort to improve this process. The ultimate goal is to have a sophisticated ETOR engine that can dynamically predict ETOR based on various factors such as total damage, present and future crew resources, and the priority of the particular outage area.
One of the most unique innovations for customer communication involves having customers take pictures of damaged facilities and submit them to Oncor’s OMS where the pictures are linked with a trouble ticket and its location.
When a customer calls in an outage, wire down, or some other perceived dangerous situation, they are asked if they would be willing to take a picture of it and they are given instructions to stay a safe distance away from the facilities. If they are agreeable, a link is sent to their cell phone and they can submit up to 10 pictures.
These pictures have been very helpful in prioritizing work, differentiating Oncor facilities from other providers such as telephone cable, providing some initial damage assessments, and identifying situations where customer facilities must be repaired prior to Oncor restoring service.
In a similar fashion to using customer generated pictures, Oncor provides damage evaluators in the field the ability to take pictures that are linked to trouble tickets and send them back in a manageable and organized form. This allows a large number of relatively inexperienced people to be the field-eyes for more experienced damage evaluators back at the control center. This process improves productivity and allows Oncor to scale its workforce for very larges storms.
Process Improvement Analytics
Besides providing real-time insights to operations, data analytics also plays an important role in Oncor’s effort on continuously improving processes in all areas that affect operations.
In this section, a few examples will be given to introduce how Oncor is maintaining our distribution record system, conducting proactive maintenance for asset health, reviewing historical events to learn lessons, and leveraging cutting-edge machine learning techniques for image processing.
Oncor uses AEGIS, a geographic information system (GIS), as the record system for distribution. The system maintains the as-designed model and serves as the data source for distribution planning and the OMS. The data accuracy of this system highly impacts many processes in operations. We have developed over 30 data validation algorithms to detect typical data issues that require manual corrections. These algorithms are run on Spark 2 times every week to scan the entire dataset and export found issues into a user interface that is used to assign correction tasks to corresponding groups. We also have processes to detect issues that can be batch corrected. Since these issues are not reviewed manually, we designed sophisticated algorithms to keep the number of false positives at a very low level. For example, for meter-to-transformer connectivity issues, we designed a 5-step algorithm to refine meter GPS location, detect location-based outliers, detect outliers based on meter voltage readings, find possible correction solutions and compare correlations, and finally give correction recommendations with confidence levels. This process will help ensure that the transformer serving a customer is accurately documented in our record system, so that any outage reported by this customer’s meter will be analyzed correctly.
As the largest utility company in the state of Texas, Oncor has more than 1 million distribution class transformers, which can fail from damaged coils or overload degradation. Reactive replacement of a failed transformer can take more than 4 hours, but proactive replacements often take less than 1 hour. Thus, detecting failure precursors can significantly reduce both labor costs and outage time. Figure 4 shows a plot of the voltage and load measurements from a single-phase 240-V AMI meter. Both voltage “V1” (in Volts) and load “LOAD” (in kWh) time series, in red and gray, respectively, have a 15-min resolution. The two horizontal lines are the upper and lower limits of the operating voltage ratings defined by the American National Standards Institute (ANSI C84.1-2020), which are ±5% of the nominal voltage. On June 24, 2018, the voltage suddenly rose above the upper limit due to a damaged coil on the primary side of the transformer. The sudden drop in voltage on July 18, 2018, denotes the time of the replacement. Often, a transformer will not fail immediately after a coil is damaged.
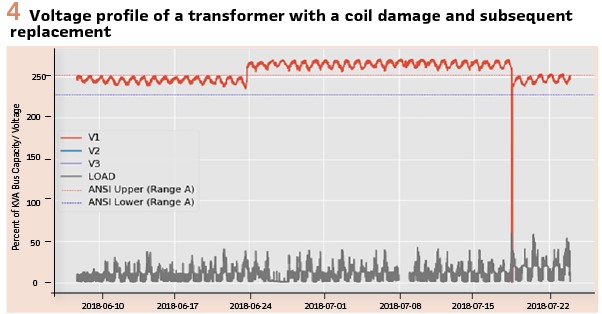
Therefore, proactive replacement is realistic and valuable if a change in voltage can be detected soon enough. Currently we have an automatic process to flag abnormal voltage behaviors (with 94% accuracy) and send notifications to service centers for investigation and proactive replacement. On average, this process sends 300 detected cases per month, and the estimated savings are $95K per month.
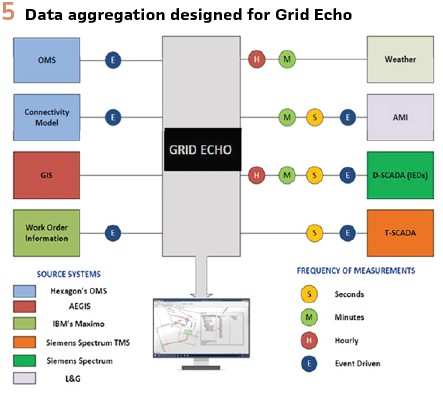
To learn lessons from historic events and be able to play back the restoration steps, Oncor created the Grid Echo system. This system forms a digital twin of the distribution system by combining OMS, SCADA, AMS, and distribution automation data into a single model as shown in Figure 5. This model is used for operator training as a simulator, and as an input for post-event root-cause-analysis processes. By visualizing and reviewing the aggregated data, we are able to identify improvement opportunities for outage restoration and distribution automation device coordination. We are also developing new functionalities to review storm impact in each area of Oncor’s territory. By designing separate metrics for measuring levels of weather severity, system resiliency per area, storm damage, and restoration productivity, we are able to establish baselines and expectations on future storms’ impact.
Therefore, we will be able to investigate and learn the root causes for any outlier cases that are far above or below expectations. The insights that we gain from this type of studies will help us continue to improve our service quality.
With the rapid growth in the research community for deep learning methods, Oncor is also evaluating opportunities to leverage advanced machine learning techniques in the area of image processing, using aerial images generated by aircraft, LIDAR or satellite images. We have successfully employed an object detection model You Only Look Once, Version 3 (YOLOv3) to classify the composition type (wood, steel, or concrete) of the beams on transmission towers and the design type (H-frame, A-frame, etc.) so that we can prioritize the maintenance efforts. We are also applying this method to images of distribution structures to detect defective insulators and broken crossarms. In addition, Oncor’s Vegetation Management program is primarily driven by image processing to assess system conditions and prioritize vegetation management work in a proactive manner.
Conclusion
Oncor has transformed distribution operation by applying new technology, integrating large systems, developing big-data platforms and tools, and expanding and developing its workforce. Many benefits of this work are already being harvested, and there are many more benefits in various stages of development. It is expected that development in these areas will continue, especially in the data analytics domain. At the same time, it is also important for more AI algorithms, that are interpretable, robust, and scalable, to emerge from research efforts which will greatly facilitate practical applications in utilities.
Biographies:
Yannan Sun is a Principal Data Scientist at Oncor Electric Delivery. She is currently in Distribution Operation Center Technical Support Group, and previously in Maintenance Strategy and Transmission Planning. She has contributions in many data analytics use cases at Oncor by providing insights, designing data-driven approaches and implementing machine learning algorithms. She is also an expert on process improvement using Lean Six Sigma tools. Prior to Oncor, she was a Senior Scientist at Pacific Northwest National Laboratory in the Electricity Infrastructure group for 7 years. Dr. Sun is the previous Chair of the IEEE PES Subcommittee on Big Data & Analytics for Power Systems.
Mark Carpenter is Sr. Vice President of Transmission & Distribution Operations at Oncor. Over his 52-year career at Oncor, he has held various field and engineering management positions in both transmission and distribution. Previous assignments include Vice President-Chief Information Officer, Vice President-Chief Technology Officer, Director of Engineering, and Director of System Protection. Mark is also an IEEE Fellow, an honorary member of the IEEE Power System Relaying Committee, a member of the IEEE/PES Industrial Advisory Council, and a member of the Texas Society of Professional Engineers. He is a registered Professional Engineer in the State of Texas and is on the Dean of Engineering Council at Texas Tech. In 2021 he received the IEEE PES Leadership in Power award.


