by A. Janardhan, G Praveen Kumar, T Madan Kumar and MVL Rajendra, GRID-INDIA, India
In response to escalating environmental concerns, global power systems are moving towards clean and sustainable energy sources like wind and solar. In India, the Southern Regional (SR) grid stands as the third largest, catering to a maximum electricity demand of 66 GW. At present the region showcases a generation mix comprising approximately 42% from renewable energy sources, with an installed capacity of 53 GW(1). Both wind and solar generators are key contributors to this renewable mix, rely on power electronic converters (PEC) for energy conversion and precise control of active and reactive power. However, these systems are highly susceptible to fluctuations in power system parameters like voltage and frequency, necessitating implementation of various protective mechanisms to ensure safety during abnormal grid conditions.

The Southern Region has experienced two major instances of grid-connected renewable energy (RE) generators tripping during line-to-line faults in the transmission network. This article presents the response of these grid- connected RE plants during unbalanced faults, particularly highlighting the role of PV inverter protection settings such as Phase Locked Loop (PLL) synchronization loss, DC unbalance protection, DC overcurrent protection, and Zero crossing protections in triggering these trips.
Through an analysis utilizing phasor measurement data (PMU), the response of RE plants is compared with simulation results from Electro Magnetic Transient (EMT) models. The comparison reveals a disparity wherein the absence of modelling for protection settings in the EMT models allows plants to ride through unbalanced faults successfully in simulations, while in reality, these plants experience tripping. The article discusses remedial actions proposed to prevent such occurrences, emphasizing insights gained from conservative settings for under frequency protection and vector surge protections, based on comprehensive analysis and empirical experience.

Renewable energy offers a sustainable solution to mitigate the environmental impact of fossil fuel-based electricity generation. The global shift towards renewable sources is driven by their numerous advantages over traditional energy systems, spurred further by technological advancements in power electronics and materials, leading to cost reductions in renewables like solar and wind. Many developing nations have set ambitious renewable energy targets, with India aiming for 500 GW of renewable power generation by 2030, including 400 GW from solar and 30 GW from offshore wind. However, as renewable penetration increases, grid integration becomes a critical challenge, impacting grid stability. Inverter-based resources must mimic the behavior of conventional generators during faults for seamless integration. While integrating renewables offers benefits such as reduced congestion, reliable power, and environmental sustainability, it also poses challenges. Fluctuations in power output result in high swings along feeders, unstable network operation, and voltage fluctuations which can cause grid stability issues.
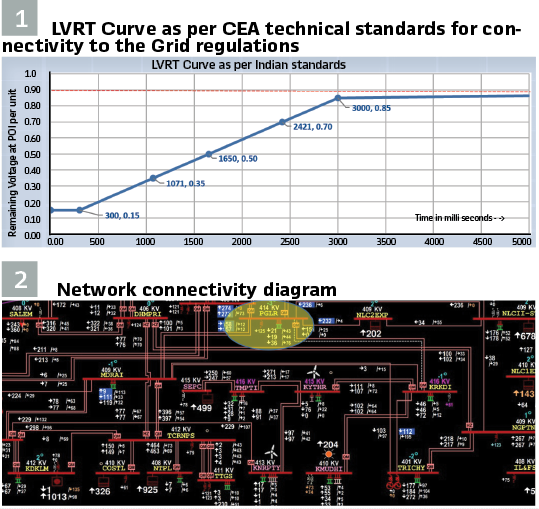
LVRT requirement for renewable energy generating stations
As per CEA Technical Standards for connectivity to the Grid regulations, the RE generating station connected to the grid, shall remain connected to the grid up to 0.15pu voltage for 300 ms at Point of Interconnection (POI). The LVRT curve as per the above mentioned regulations is shown in Figure1 for various voltages at POI. During LVRT scenarios, priority is given for supplying reactive power followed by active power. Once voltage is recovered, the active power should be brought back to at least 90% of its pre-fault level within 1 second.
EVENT-1: Description and RE Plant Responses during the Event:
400KV Network connectivity of PGLR S/S: In southern region grid, 400/230kV PGLR substation is one of the critical stations located in central part of Tamil Nadu state. The station is synchronously connected to the HVAC section of the adjacent HVDC substation, which exchanges power with Western Region of the country through LCC based HVDC and to the state of Kerala through VSC based HVDC. In addition to this, large amount of renewable generation is connected in the 230kV downstream network and more renewable energy is being planned to get pooled at this station in future. (Figure 2).
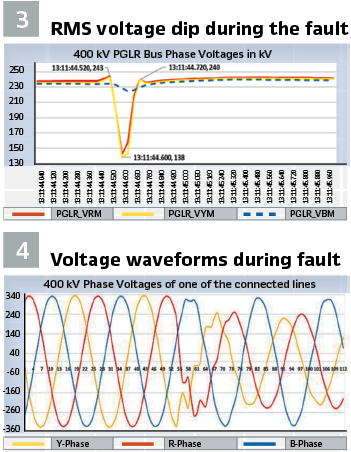
During one instance, a phase-to-phase fault (R-Y) occurred on 400kV transmission line connected to PGLR station. The positive sequence RMS voltage dipped to 0.6pu during the event. Subsequently, the fault was cleared within 100 ms. According to the LVRT curve, the RE generators shall remain connected to the grid for a minimum period of 1.65 secs for voltage dip of 0.6pu at POI. Due to the dip in voltage, the Renewable Energy generators connected to PGLR, and nearby stations went to LVRT mode. Majority of the wind generators could successfully ride through and some of the solar plants tripped during the fault. Voltage dip observed in 400kV PGLR Bus Phasor Measurement Unit (PMU) is shown in Figure 3.
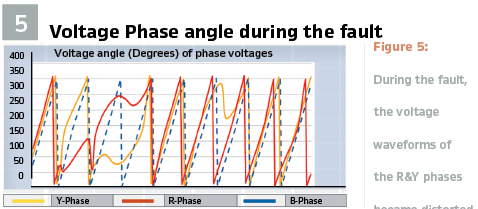
During the fault, the voltage waveforms of the R&Y phases became distorted, accompanied by shifts in voltage phase angles due to imbalance as shown in Figure 5.
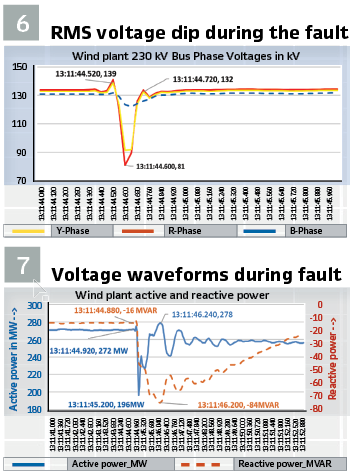
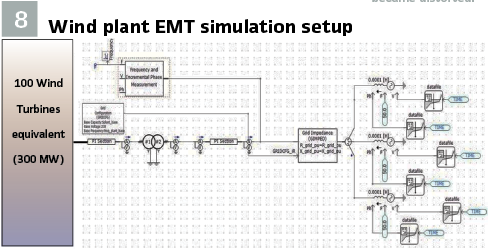
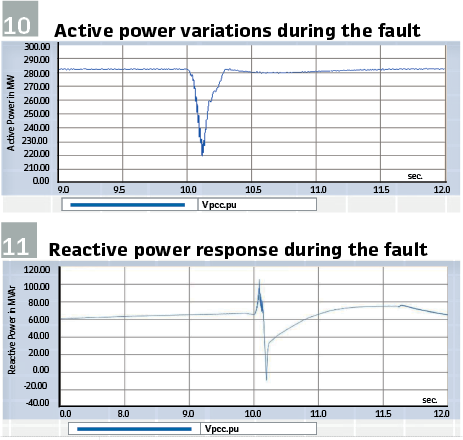
The response of the 300 MW Wind plant is as follows: During the fault event, the wind farm, consisting of 100 Type-3 (Doubly Fed Induction Generator) Wind Turbine Generators (WTGs) encountered a voltage dip of around 0.65 per unit at the 230kV POI bus. Initially the wind farm was generating 272 MW with a reactive power absorption of 16 MVAR. Subsequently, the active power output was decreased to 196 MW during the fault, subsequently recovering to 278 MW within one second. Following the fault, there were well-damped oscillations in the active power for a duration of 3 seconds before settling. However, the reactive power absorption is increased to 84 MVAR,during voltage dips the plant should inject the reactive power. (see Figures 6,7).
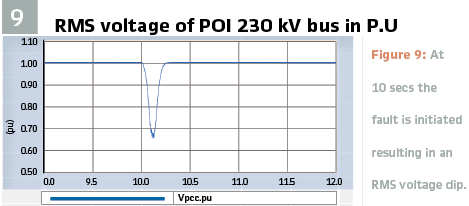
EMT Model simulation response: The voltage waveforms for each phase are captured from the disturbance recorder (DR) of the substation during the fault. The wind plant’s equivalent model is constructed in PSCAD using the NREL equivalencing methodology. The grid is represented as three single-phase sources with short-circuit MVA values obtained from the steady-state network model. The source control is configured externally, with the instantaneous voltage and angle specified according to the DR data. The simulation setup is outlined in Figure 8. The plant’s active power set point is maintained at 0.97 PU to reflect the actual generation level during the fault occurrence. At 10 seconds into the simulation, the fault is initiated, resulting in an RMS voltage dip to 0.65 PU as shown in Figure 9.
The active power dipped to 220 MW from 280 MW and recovered to 280 MW within one second, complying with the standards as shown in Figure 10.
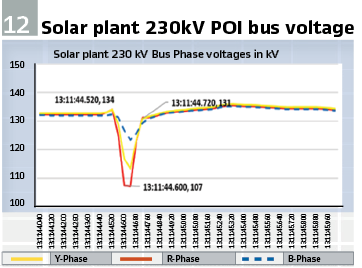
The response of the 150 MW solar plant is as follows: The plant comprises of 60 PV inverters, each with a capacity of 2.55 MVA. During the fault, the voltage at the 230kV Point of Interconnection (POI) bus dipped to 0.8 pu as shown in Figure 12
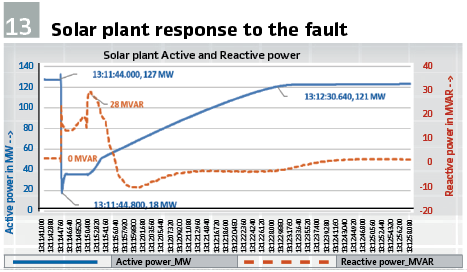
Prior to the fault, the plant was generating active power of 127 MW with no reactive power absorption. However, during the fault, the active power output decreased to 18 MW, recovering to 36 MW within one second after voltage restoration. Approximately 70% of the inverters tripped during the fault due to phase jump protection, which was set at 15 degrees. The inverters restarted after 5 seconds, with the active power recovering to 121 MW after 45 seconds as shown in Figure 13.
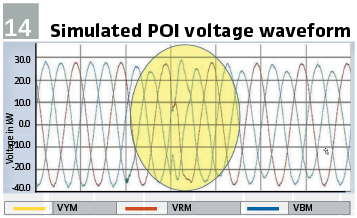
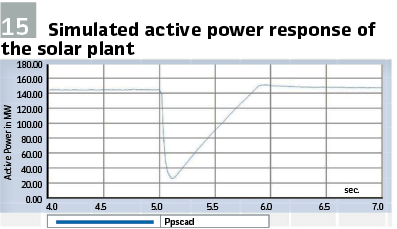
EMT Model simulation response: The equivalent model of the 150 MW solar plant is implemented in PSCAD, where the instantaneous voltage and phase angle data of the fault are supplied through external source control. The voltage profile at the 33kV bus is shown in Figure 14.
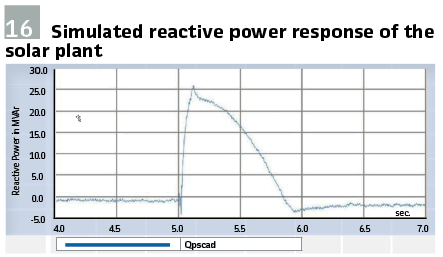
In the simulation, the active power decreased to approximately 24 MW, which closely aligns with the actual performance where the active power dipped to 18 MW during the fault. However, in the simulation, the active power recovered to its pre-fault level within one second. In reality, the inverters tripped during the fault and subsequently restarted one after the other, resulting in full active power restoration in 45 seconds. The reactive power injection in the simulation was 25 MVAR, which closely matched the actual performance of 28 MVAR. Due to the phase-to-phase fault, there was distortion in the voltage waveforms, and the phase angle jumped during the fault. The solar inverter continuously monitors the phase angle of the grid voltage.
A predefined threshold is set for the acceptable phase angle difference between the inverter output and the grid voltage. If the phase angle difference exceeds this threshold, it indicates a phase jump. As the field implementation included phase jump protection, the inverters tripped. However, since the same protection details were not incorporated into the model, the inverters successfully rode through the fault. It is imperative to accurately model all protection details of renewable energy plants to ensure their behavior is faithfully replicated in simulations. (Figures 15, 16).
EVENT-2: Description and RE Plant Response during the Event
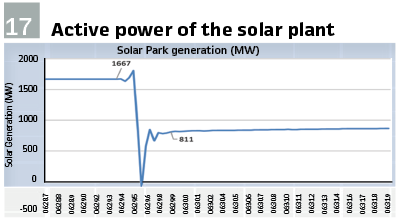
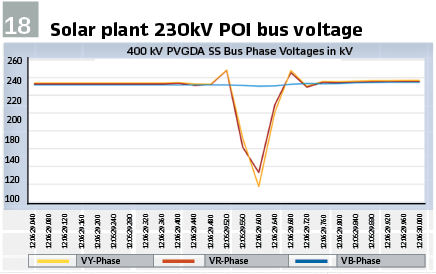
The 400/220kV PVGDA SS serves as a 2050 MW solar power park evacuation station. A phase-to- phase fault occurred due to a fire in the fixed series capacitor installed at the station, causing the 400kV PVGDA voltage to drop to approximately 0.5 per unit in the affected phases. The fault was promptly cleared within 120 milliseconds, and the voltage recovered within the same duration after fault clearance. (Figure 18). Prior to the fault, the plant was generating 1667 MW. However, this output was decreased to 811 MW following the fault, indicating the tripping of some PV inverters. (Figure 17).
The solar park comprises of different make of PV inverters that can be broadly categorized into eight different types. Each of these types exhibit a unique tripping mechanism during the fault event. However only four of these types were seen with the inverter protections tripped during the fault.
For PV Inverter Type-1, tripping occurs due to DC voltage unbalance protection. This protection activates when the DC voltage disparity between the common point to positive bus bar and negative bus bar to common exceeds a predefined threshold. During normal operation, this voltage difference remains minimal. However, difference surpasses 400V during the fault and triggers the inverter tripping. Following tripping, manual restart of the inverters is required.
PV Inverter Type-2 is susceptible to tripping based on protection that detects zero crossings occurring before 10ms in each cycle. If the voltage waveform crosses zero before this threshold, the inverter is triggered to trip. Although the disturbance recorder (DR) indicates that at the Point of Interconnection (POI), the voltage waveform does not cross zero before 10ms, it does so at the inverter bus, leading to tripping. Similar to Type-1, manual restart of the inverters is necessary post-tripping.
PV Inverter Type-3 experiences tripping due to various factors including DC voltage unbalance, DC overcurrent, and Phase Locked Loop (PLL) synchronization loss.
For PV Inverter Type-4, tripping is triggered by phase jump protection, as detailed earlier. Other inverters did not trip and successfully ride through during the fault.
Conclusions
The analysis of wind and solar plant’s LVRT compliance for phase-to-phase faults is conducted using PMU data, and their actual performance is compared with EMT simulation results. The simulated reduction in active power and provision of reactive power support by renewable energy (RE) plants closely match the actual values. However, due to incomplete inclusion of protection settings in the EMT model, the simulated recovery of active power post-fault contrasts with the reality where PV inverters tripped.

In the second incident, inverters tripped on various protections, underscoring the necessity of incorporating all protection settings of PV inverters and wind turbine generators (WTGs) in simulation models to accurately reflect their behavior.
This becomes crucial, particularly with the proliferation of large-scale RE parks in the gigawatt range. Furthermore, benchmarking of RE models against real- world incidents and regular updates are imperative. Additionally, the availability of high-resolution data at the point of interconnection aids in analyzing minute details and comprehending the response of RE plants to various fault signatures.
Biographies.

Asudi Janardhan is a Chief Manager at the Southern Regional Load Despatch Centre (SRLDC), Grid-India, with over a decade of experience in power system operations. Since 2013, he has been involved in real-time grid operations, reliability coordinator, and grid security engineer. His expertise includes generation dispatch, black start, power system modelling and simulation using PSS/E and PSCAD, renewable energy grid integration and forecasting, active and reactive power testing of conventional and renewable energy plants and he is actively involved in developing AI-based tools for improved system operation. He holds a Bachelor’s degree in Electrical and Electronics Engineering from NIT Warangal.

Gurram Praveen Kumar is a Chief Manager at the Southern Regional Load Despatch Centre (SRLDC), Grid-India, with over a decade of experience in power system operations. Since 2014, he has been actively involved in real-time grid operations, serving in roles such as Reliability Coordinator and Grid Security Engineer. His areas of expertise include generation dispatch, black start operations, power system modelling and simulation using PSS®E and PSCAD, renewable energy grid integration, and active and reactive power testing of both conventional and renewable energy generating plants. He is also actively involved in the development of software tools for generation dispatch and system operation support. He holds a Bachelor’s degree in Electrical and Electronics Engineering from SNIST, affiliated with JNTU Hyderabad (JNTUH).

Madan Kumar Tallapalem is a Deputy Manager at Southern Regional Load Despatch Centre (SRLDC), GRID-INDIA, with over six years of experience in power system operations and planning. His expertise spans system reliability, transmission planning studies, transmission pricing, transfer capability assessment and transmission outage coordination. He has been actively involved in compliance assessment of renewable energy integration, primary frequency response testing, PSS testing, validation of power plant controllers operations in RE plants and first-time energization studies. A University Topper and Gold Medalist from Sri Venkateswara University, Tirupati, he is also well-equipped with automation expertise, particularly in Python-based PSS®E studies, enabling efficient and data-driven power system analysis.

M V L Rajendra is a Deputy Manager at the Southern Regional Load Despatch Centre (SRLDC), Grid-India, with over six years of experience in power system operations. Since 2019, he has been involved in real-time grid operations, reliability coordinator, and grid security engineer. His expertise includes preparation of real time cases, Automation of renewable compliance check in PSSE & PSCAD, power system modelling over voltage grading analysis in transmission network and simulation using PSS/E and PSCAD, renewable energy grid integration and PPC testing. He holds a Master’s degree in Power Systems from IIT Kharagpur.