by Rodolphe Hanuise and Cedric Moors, Elia Engineering, and Fernando Calero, Milind Malichkar, and Eliseo Alcazar, Schweitzer Engineering Laboratories, Inc. USA
Elia is a transmission system operator (TSO) and is active in electricity transmission. With main subsidiaries in Belgium and northeast Germany, Elia operates 19,300 km of high-voltage connections and 800 substations that supply power to 30 million end users, which makes the Elia one of Europe’s top five largest TSOs. Elia is connected to the continental European synchronous network, which is the most powerful synchronous electrical grid in the world (26 countries and 860 GW). Elia is at the center of it and a very important link for international power flow, which is increasing as generation becomes more decentralized. A European goal is to achieve carbon neutrality before 2050. Consequently, integration of renewable energy sources is drastically increasing (specifically wind for Elia). Integration of more power electronics (renewable energy resources [RES] and high-voltage direct current [HVdc]) into the power system is creating challenges that must be solved with special engineering solutions.
Members of the European Union are investing greatly in nonconventional sources. In Belgium, offshore wind generation projects have concentrated electric power generation on the ocean in the northwestern part of the country. Moreover, Belgium integrates with the United Kingdom (UK) through a dc cable, requiring an inverter (HVdc) installation in the same geographical area.
Elia performed steady-state and unusual electromagnetic transient (EMT) studies before construction to identify low- probability contingencies on the corridor impacting the Belgian system (e.g., blackout and/or brownout). These instabilities come from two nonconventional sources (wind and HVdc), which represent a challenge because unusual operating conditions leading to a low short-circuit ratio could result in damage to the wind and HVdc installations and blackouts in Belgium.
Elia is the operator of the power corridor that transports the associated energy. To reliably operate the corridor and protect against power system contingencies, Elia decided that a System Integrity Protection Scheme (SIPS) was required.
The Power Corridor
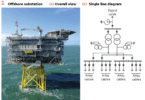
Figure 1 shows the single-line diagram of the Belgium power corridor. At peak generation, the offshore wind generation can reach 2,000 MW, injected into the system at Substation 1 (Sub 1). The exchange with the UK, at its peak, can reach 1,000 MW, injected at Sub 2. These two sources of power are delivered to Europe and Belgium through the substation axis formed by transmission lines from Sub 1 to Sub 4. The European interconnected grid is linked into Sub 4. The 400 kV lines and cables that carry the power, mostly in the direction shown in Figure 1, are capable of carrying the maximum generated power, even individually. The alternate path of the power, via the 150 kV grid, is not capable of transporting the flow.
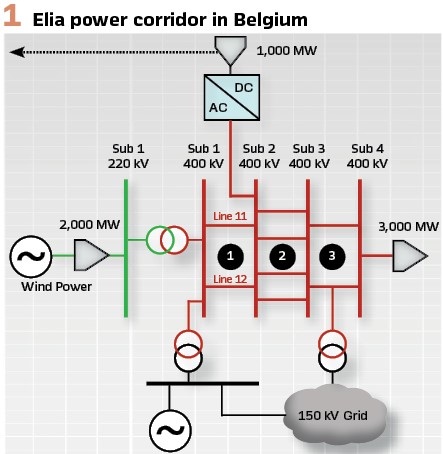
Having unconventional sources in the power system requires unusual considerations. Assuming, for example, the power flows through the corridor of the 3,000 MW in the same direction (towards continental Europe) as shown in Figure 1, the power corridor is the only path for this power to flow through.
Wind power and the HVdc link do not have the mechanical inertia of rotating machines; rather, they have specialized control loops to fire the power electronics to invert the power flow from dc to ac. These control loops are feedback schemes that use the measurement of the voltage for reference (governed by the main grid). Moreover, wind generation is not a single machine, but hundreds of units in the offshore installation. Understanding and modeling the behavior of these wind generators when islanded from the main power grid is a very difficult engineering task.
Further, the second major inverter source (HVdc link to the UK) is also controlled by feedback loops based on the reference vltage measurement governed by the main grid. It is a difficult task to estimate the interaction between the wind generation and the HVdc link when these are operating without the main path.However, Elia was able to do modeling, perform simulations, and make some educated assumptions to show very quick and significant power oscillation that can lead to a cascading effect when the main path is lost. These studies also showed significant overvoltages and frequency oscillation that could damage equipment when wind farms and HVdc are islanded together.
The most prudent action to take is to totally disconnect the wind generation and HVdc conversion to avoid unwanted consequences when the power corridor is lost.
The SIPS mission is to separate the power electronics as fast as possible when the loss of the power corridor is detected, as shown in Figure 1.
SIPS Design
Given the importance of the power corridor, Elia determined demanding requirements for the design of the SIPS in terms of speed, reliability, security, and redundancy.
No single point of failure was allowed in the whole scheme, and it required at least two equal systems in parallel (A and B system). The failure of a single device should not prevent the flow of electrical power in the corridor.
The design needed to consider a voting scheme where the input status and output trip commands to the breaker had to be voted on, so a “two out of four” logic was implemented.
The operating speed of the SIPS had to be less than 44 ms without the breaker operating time. The SIPS should be designed with appropriate hardware to have fast reaction times.
Cybersecurity was an important consideration. The SIPS scheme influence spans a wide area and includes several substations; unknown data traffic should not be allowed. The SIPS measurements and control commands should not be able to be hacked or even allow unauthorized access.
The design included distributed controllers in the four substations. Human-machine interface (HMI) and configuration facilities had to be accessible in each substation, as well as from the Elia control center.
Distributed Architecture
The design is based on a distributed architecture that complies with the requirements in the previous section. In each of the four substations of Figure 1, controllers executing SIPS logic and monitoring are provided.
To account for the redundancy requirement, two equal and independent schemes are used. Certainly, this is the simplest answer to achieve continuity of service, even when an important component is lost. For the purposes of identification, the systems and their controllers are identified as A and B.
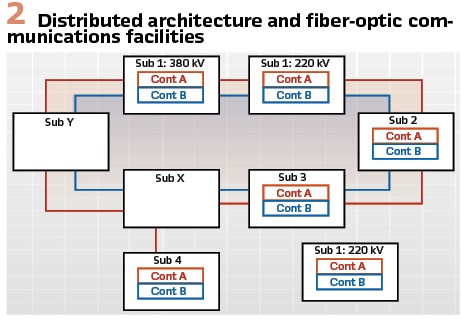
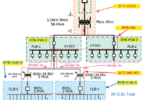
As this was a new installation, the corridor transmission lines were equipped with a significant number of fiber-optic pairs, with two pairs dedicated to the SIPS. Figure 2 shows the fiber-optic communications paths. The fiber connections of Sub 4 are physically connected to Sub X.
Figure 2 illustrates the placement of the two logic controllers in each of the project substations for a distributed architecture, as well as the communications fiber-optic loop available for the project. The two systems are interconnected through their respective communications fiber optics. The measurements and status from any substation are available at the other substations. In a distributed architecture, the decision-making devices make their own decisions with the data from remote sites.
The use of the architecture allows for the programming of the controllers basically with the same program. The controllers execute the same program in all the substations. Minor differences are unavoidable, such as the binary output signal assignment to trip the breakers in the substations and the IP address of the device, but other than that, the controllers have identical programs running.
The fiber-optic loop provides redundancy in the communications. If the fiber breaks in some part of the loop, there is still a path from substation to substation. Each line in both terminals has two line-monitoring devices: Line Monitor A (Linemon A) and Linemon B. In each substation, the line-monitoring devices measure power flow and breaker status information.
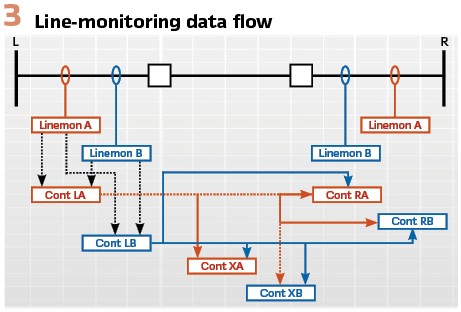
These data are published in both networks and subscribed to by the local controllers and all the controllers in other substations. Figure 3 illustrates the flow of information for the line-monitoring function. Each terminal has System A and System B line monitors. These publish the measurements to both of the local controllers (Cont), as illustrated in Figure 3 in Terminal L. The local controllers use the information, as illustrated in Figure 3.
There is no single point of failure in the architecture, and the failure of any single device in the architecture does not impair the operation of the SIPS.
Voting Scheme
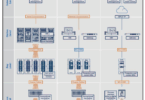
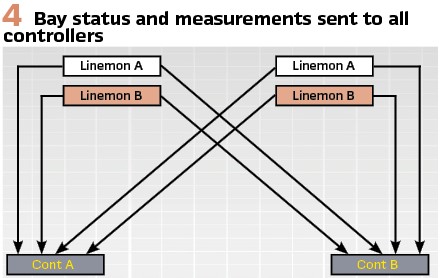
The measurements and binary statuses of the bays are sent to all the controllers in the system. Figure 4 illustrates the exchange and redundancy.
The bay status is required to determine the line status. To determine that the line has suddenly opened, a voting scheme is implemented in the controllers. The idea is to provide an additional layer of security for decision-making. Figure 5 illustrates the logic; it is essentially a two-out-of-four logic to assert the internal controller bit.
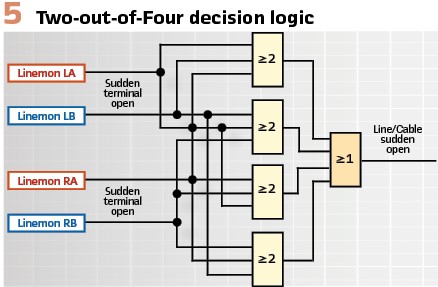
The two-out-of-four comparison is executed in every controller of the SIPS. The analog values are treated differently, however, because they need to be within a tolerance band, and the average is an output from the good values.
Operating Speed
A key parameter to the operation of a SIPS is the operating speed. The breaker operating times are not considered, and it is only the decision-making time that needs to be documented. Most SIPS and wide-area protection and control schemes base their requirements on power system studies. In large power systems, it is common to require operating times of less than 0.1 second. In the SIPS described in this paper, the request was for a system with an operating time of less than 44 ms.
Due to the high-speed communications used (IEC 61850 GOOSE) and the fast controller operating time, the operating speed obtained was in the range of 14 to 20 ms after a line disconnected the corridor. The preliminary calculation considered 15 ms in the line monitor, 5 ms transmission and GOOSE message processing, and 3 ms in the controller, plus a margin. The measured time was better than the estimate.
SIPS Development
Through numerous design development and review meetings, various components of the scheme were finalized, keeping in mind the speed, security and redundancy specifications. Given the criticality of the infrastructure and the need for continuous power flow through the corridor, it was imperative that the system be secure and not operate for any events other than specified contingencies. To ensure the highest level of availability, complete redundancy was preferred in the SIPS. This requirement drove the necessity to use the redundancy not only at the hardware platform but also on the field data acquisition (such as independent current transformers [CTs], potential transformers [PTs], and breaker status for the A and B SIPSs). Redundancy was also built on the communications architecture using PRP, SDN technology, and redundant communications paths; so, even in the majority of cases, this architecture can handle an N – 3 contingency. Cybersecurity was achieved by the use of SDN and by designing the network flows in a way that only SIPS traffic is allowed on dedicated optical fibers between substations.
Once finalized, the SIPS design was implemented using the line-monitoring devices, SIPS logic controllers, and network communication devices. The SIPS design criteria called for a robust hardware platform, fast and easy-to-program controllers and line monitors, and cybersecure network communications devices.
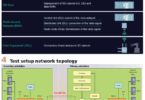
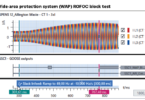
SIPS Validation with Real-time Simulation
The SIPS logic, using all substation panels, was tested in the lab with a real-time simulation using HIL. Real-Time Simulator Computer-Aided Design (RSCAD) software was used to build the model. In the RSCAD draft module, the Elia electrical system was modeled graphically, and data were assigned to points. A completed model, with graphics and data, was then designated as a “case.” Once a power system case is built, the case is compiled on the real-time digital simulator (RTDS) hardware and then executed in the RTDS runtime module. All controls for interfacing with the model in real time are placed in this module. This includes, but is not limited to, sliders for changing set points, raising and lowering controls, breaker controls, fault controls, and plots for capturing data. The data captured from testing can be downloaded and saved for later analysis.
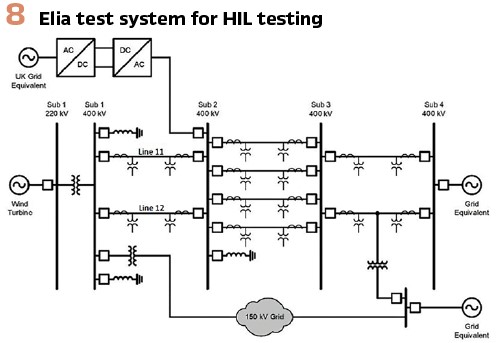
The electrical model developed included all the substations on the corridor and transmission lines and cables connecting these substations. In addition, the offshore wind farm system and the dc link connecting to the UK were modeled using the manufacturer’s data and previously studied models from the library of simulation software. The built system was completely validated using the short-circuit and load-flow studies to achieve accurate testing results. Moreover, another validation was made between the RTDS model results and those from offline simulation on PSCAD using library models provided by manufacturers of HVdc and wind farms, when available. Figure 8 shows the test system modeled in the RSCAD.
On the control side, the model also included simulated protective relaying, tripping, reclosing, and interlock tripping to observe the interaction of the SIPS with the existing protection system. In addition, breaker-failure and pole- discrepancy protection was simulated to observe the interaction with the SIPS.
Various contingencies were simulated for the SIPS logic testing. One of the scenarios tested is described in this section. The case was run with normal power flow of 1.8 GW from the wind farms and 1 GW imported on the dc link in a standard topology (Figure 8).
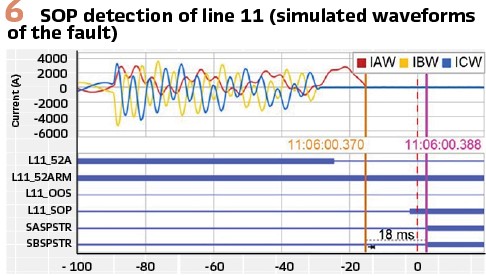
A simultaneous three-phase fault was created on Line 11 and Line 12. Both Line 11 and Line 12 breakers opened at both ends in 60 ms, which included the protective relay operation time and the breaker opening time. Once the breakers opened, the line monitor detected the open position of the breaker, and the current through the breakers fell to zero. The line monitor consequently issued a SOP (Sudden opening) of the breaker signal to the controllers.
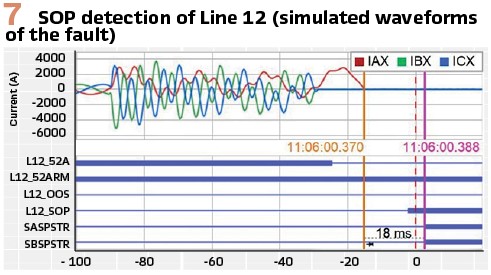
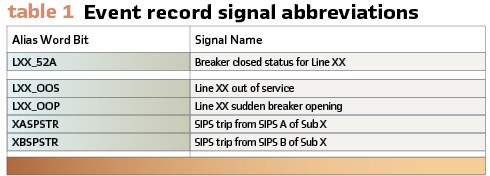
The waveforms in Figure 6 and Figure 7 show the simulated fault currents from the wind farm models, built using library components from the simulation software. The waveforms suggest the damaging nature of the currents from the inverter-based sources. The signal names used in the plots are listed in Table I.
The SOP bits of both lines are transmitted from the line monitors to the SIPS controller via IEC 61850 GOOSE messaging. The controller logic detects a contingency due to the presence of SOP on both lines by way of a two-out-of-four logic assertion. For this event, the SIPS acted on the contingency and tripped all the breakers to isolate the wind farms and dc link from the rest of the Elia grid in 18 ms after the current on both lines decayed to zero after breaker opening.
Additionally, several other tests were conducted to completely validate the SIPS logic under all expected power system scenarios. These tests included the following scenarios:
- Low power flow (near threshold)
- Reversing power flow direction to test the arming and disarming of the SIPS logic
- Reclosing and breaker failure scenarios
- Maintenance scenarios with secondary CT injection on one line with fault on the other in-service line
- Special topology with decoupled buses
All the results obtained were satisfactory with consistent speed of response.
The SIPS in the Fields
A complete factory-tested SIPS was installed in all five substations. Once all the field signals for CTs, PTs, breaker status, and trip signals were connected, detailed functional tests were performed to verify that the field connections were correct. Secondary injection testing was performed for every CT and PT connected to the line monitors, and breaker operation testing was performed for every line breaker on the corridor that was providing breaker status to the line monitors.
Breaker trip tests were done to verify the tripping of the breakers from the SIPS.
The SIPS was functional after the connection of the fiber-optic cables. Before putting the SIPS in service, a complete health check of the system was performed. The communication latency was observed and found satisfactory and within estimates.
At the time of writing this paper, the SIPS is working securely and has been providing protection on the corridor for several years. It has not been called on to operate as the power system has experienced fault but no complete loss of the corridor. However, the authors were able to validate the speed of line-loss detection logic on the manual line-switching operations.
Conclusion
This article described a unique SIPS scheme. The considerations and requirements were solved with appropriate technologies to create a robust system. SIPS schemes are required in modern power systems to solve wide-area problems arising from the different operating conditions. In this case, it is the islanded operation of two nonconventional sources injecting significant power at the same time. The SIPS described maintains the integrity and stability of the Belgium and continental European network, which is the most powerful synchronous network in the world.
Redundancy requirements yielded a high-availability system. There is no N – 1 contingency that can render the system inoperable. In fact, the communications network can tolerate many more contingencies and keep the system operational. The SDN and PRP combination creates a very robust network.
Cybersecurity was an important consideration in the design. The requirement that only control messages travel in the SDN network made it very simple.
The real-time testing was very helpful to debug the system and comply with the TSO operational practices and requirements. It allowed the fine tuning of the design.
The field experience operation of the system complied with the simulated scheme in the HIL testing.
Biographies:

Rodolphe Hanuise manages his own engineering consultancy company specialized in electrical engineering for industries and TSOs. He obtained his M.S.E.E. in 2008 from the Engineering University of Mons, Belgium. From 2008 to 2016, Rodolphe then worked for an international engineering company specialized in HV/MV network for TSOs and industries as project manager, technical lead and department manager. In 2016, he joined the Belgian TSO, Elia, as Asset manager for Protection and automation. In this framework, he was technical lead, project manager and responsible of the SPS described in this paper. Beginning in 2020, he created his own engineering company

Cedric Moors received his M.S.E.E. (1998) / PhD (2002) from University of Liège, Belgium. From 1998 to 2002, he took part in the development of a Special Protection Scheme with a well-known TSO from North America. In 2003, he joined the Belgian TSO, Elia, as a protection expert. In 2009, he took the lead of the Asset Performance Analysis department, in charge of analysis of all events happening on the Belgian grid. Since 2012, Cédric has been in charge of the Asset Management Secondary System department, accountable for PAC concepts definition and PAC life cycle management. He is a member of CIGRE B5 Study Committee, where he leads Thematic Group 52.

Fernando Calero is a principal engineer at Schweitzer Engineering Laboratories, Inc. (SEL). He started his professional career with the ABB relay division in Coral Springs, Florida. He also worked for Florida Power and Light in the EMS group and Siemens in the energy automation group. From 2000 to 2019, he was an application engineer in the SEL international organization. In 2020, he transferred to the R&D division. He holds 8 patents and has written technical papers on protective relaying, remedial action schemes, and other protection and control applications.

Milind Malichkar received his M.S.E.E. from Michigan Technological University in 2012 and his B.S.E.E. from Mumbai University, India, in 2005. Milind worked for Voltas limited, India, and Electromechanical Technical Associates (ETA), Abu Dhabi, UAE, as a project engineer for five years before joining Schweitzer Engineering Laboratories, Inc. (SEL) in 2012. Presently he is working as a Senior Engineering Manager at SEL Engineering Services, Inc. Milind has experience in power system protection design and commissioning, short-circuit and coordination studies. He is a licensed professional engineer in the states of Washington, California, Alaska, and Arizona.

Eliseo Alcazar Ramirez received his M.S.E.E. degree from Autonomous University of San Luis Potosí, and his B.S.E.E. degree from the Oaxaca Technological Institute in 1998. From 1999 to 2004, he worked in the Southeastern Distribution Division (SDD) of Comisión Federal de Electricidad (CFE) in Mexico. In April 2004, Eliseo joined Schweitzer Engineering Laboratories, Inc., where he is currently a senior protection engineer in Boise, Idaho. His experience includes creating solutions for industrial, distribution, transmission, and generation power systems, as well as commissioning solutions and remedial action schemes. He is a member of the IEEE.