by Gefei “Derek” Kou, Penn Markham, Thomas Purcell, Ariel Valdez, Philip VanSant, Dominion Energy, USA
Solar energy is becoming an essential resource in the power grid. Dominion Energy – the Virginia-based energy producer and transporter that provides electricity or natural gas in 20 U.S. states – has recently established the company-wide commitment to achieve net-zero carbon dioxide and methane emissions by 2050. The Virginia General Assembly also enacted legislation that mandates a 100% renewable portfolio standard of non-nuclear energy by 2045.
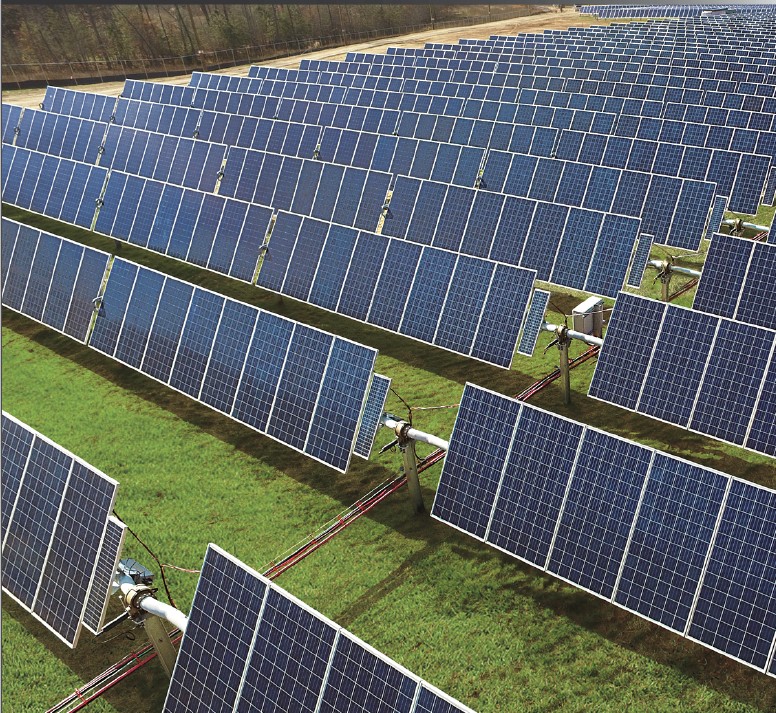
In the Commonwealth of Virginia, 16.1 gigawatts (GWs) of solar or onshore wind generation is expected to be built by 2035, which accounts for 80% of the company’s current generation capacity. The evolving energy paradigm will require a substantial amount of solar energy in the form of transmission-connected solar farms and distributed energy resources (DERs). Ensuring their reliable operation is critical to meeting demand and providing clean and sustainable electricity. To achieve this goal, monitoring solar generation and increasing situational awareness on a highly variable grid are strategic to the utility’s business and will allow it to better serve its customers.
This article documents Dominion Energy’s work to increase solar generation visibility by creating a data collection and analysis platform. The monitoring system takes advantage of off-the-shelf technologies and metering devices deployed by the utility. By collecting high time-resolution data from meters, including digital fault recorders and power quality meters, the system is able to provide real-time alerts to grid operators and field technicians.
It also performs post-mortem analysis and supports root cause analysis. Using the historical data, various tasks ranging from solar plant model validation and transient overvoltage monitoring can be conducted. The described monitoring system enhances situational awareness, enables advanced analytics, and proves valuable to solar integration.
Monitoring System Overview
Metering Device
The data capturing capability of modern power system meters offers opportunities to observe system dynamics in high time-resolution. Meters, including digital fault recorders (DFRs) and power quality meters, can achieve a high reporting rate and provide both root-mean-square (RMS) values and oscillography waveforms, which are foundational to advanced analytical studies. Those meters have been widely deployed in the power system and can be utilized for increased power system visibility.
Since their advent in the early 1980s, DFRs have been used to monitor bulk electric power systems. DFRs are deployed at transmission and key substation systems to record dynamic disturbance events and give highly valuable data for post-event analysis. Typical applications include protective relay setting verification and root cause analysis. Unlike SCADA (supervisory control and data acquisition) systems, DFRs offer a high sampling rate, typically ranging from 600 to 19,200 Hz. The highly refined data captures adequate details to interpret system transient responses, protective relay operation, and equipment control actions.
DFRs are usually installed in substations and fed with tens of analog and digital input channels. They record instantaneous currents and voltages, along with digital states, when event conditions are triggered. Newer DFRs are also capable of recording extended lengths of oscillography and RMS values. In addition, DFRs can also be used for wide-area disturbance studies when equipped with synchronizing satellite clocks.
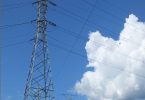
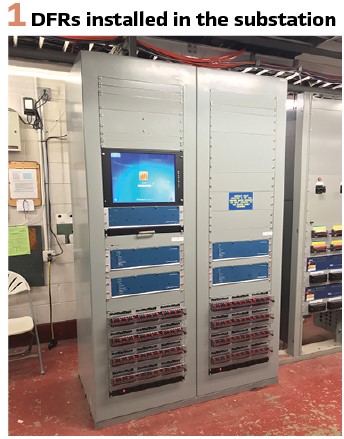
On distribution systems, power quality meters offer opportunities for granular situational awareness. Those meters take less space and can be mounted to utility poles at the point of metering (see Figure 2). The meters can capture disturbance data, sequential event records, load profile, and harmonics. Like DFRs, oscillography waveforms are collected when pre-configured conditions are met. The conditions can be current and voltage level detectors, harmonics levels, and digital status, among others. When equipped with IRIG-B timing sources, disturbance data can also be stamped with satellite clocks and used for wide-area event analysis, such as evaluating transmission events’ impact on DER operations.
System Architecture
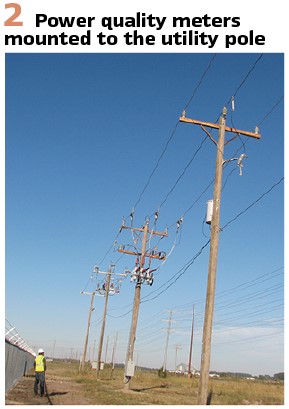
Transient oscillography recordings are saved locally in the device’s memory storage. To save field trips for data collection and enable timely event analysis, those recordings need to be retrieved remotely. The monitoring meters usually support multiple built-in communication methods, including Ethernet, fiber optics, and cellular modems.
Data are transmitted through those communication channels to the utility’s data servers for data processing and engineering analysis. For transmission-connected solar farms, the interconnection substation offers fiber optics or Ethernet connectivity that enables data transfer. For DERs, cellular modems are typically used given that most solar farms are located in remote areas. A simplified data monitoring system architecture is shown in Figure 3.
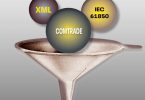
Event data files are stored in COMTRADE (Common format for Transient Data Exchange for power systems) format, which is a standard file format for storing oscillography and status data related to transient power system disturbances. The standardized data format simplifies data parsing and event processing in batch. The saved data files are archived by event time and location and can be used for both real-time and historical data applications.
Use Cases
Real-Time Visibility
Timely alerts provide system operators and field technicians with real-time situational awareness of solar plants. The information guides root cause analysis and outage restoration. System operators are typically provided with basic information such as breaker status, emergency alarms, and voltage and current RMS measurements at low time-resolution.
With the solar generation monitoring system, real-time event oscillography is sent to stakeholders in the format of an email alert. Useful information such as voltage and current waveforms and relay target bits are attached to the emails for quick event interpretation.
An example of the captured oscillography is shown in Figure 4. From top to bottom, the graph plots the instantaneous line current and voltage on the utility side, and voltage on the solar plant side. Based on the waveforms, engineers can quickly identify the root cause of an event. For example, a sustained voltage depression accompanied with current increase is likely caused by a fault on the distribution feeder (see Figure 5). Relay target bits are also included in the email alert and prove to be useful as well.
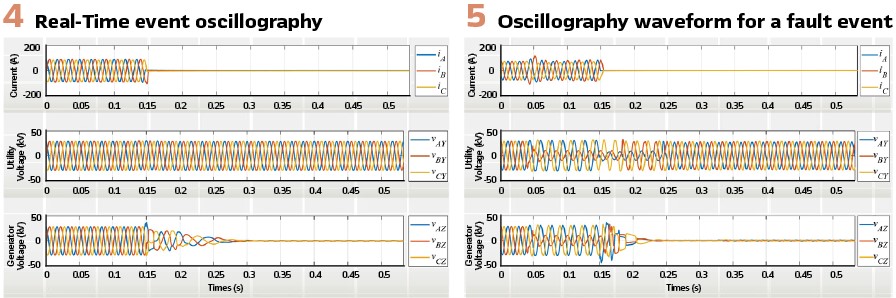
For instance, assertion of the direct transfer trip bit indicates an islanding condition is developed and the solar plant has to be tripped offline for safety. Using transient waveforms and relay target bits, the timely information can guide system and field operation and streamline response processes.
Transmission System Reliability
Solar inverters are inherently different from synchronous generators in transient fault responses. Unlike conventional generation, solar plants can exhibit momentary cessation behaviors during system faults. Such response is not preferable from a system stability viewpoint and can undermine the grid’s resiliency to faulted conditions. It is recommended in the North American Electric Reliability Corporation report “900 MW Fault Induced Solar Photovoltaic Resource Interruption Disturbance Report” that momentary cessation should not be used for new inverter-based generation and mitigated in existing generation sites. Inverter-based generators are recommended to ride through faults and continue to provide both active and reactive power support to boost system frequency and voltage.
The fault analysis system can monitor solar plants’ fault responses and verify their fault ride-through capabilities. Due to the fast-responding nature of fault events, it is challenging to capture such transient behaviors using other recording devices. SCADA systems offer a time resolution of 2-4 seconds and thus miss inverters’ controls that occur at sub-cycle time scales. Phasor Measurement Units (PMUs) typically feature a sampling rate of 30 data points per second and provide RMS instead of instantaneous values.
The fault analysis system, however, takes advantage of the high sampling rate of relay oscillography data. Such time-resolution enables solar inverter model validation for protective relaying studies.
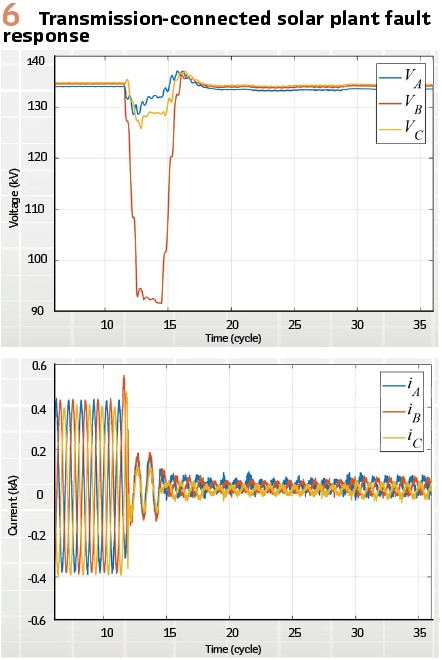
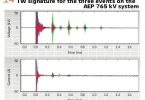
An example is given in Figure 6. A single phase-to-ground fault occurred on a 230-kV transmission line and was then cleared in three cycles. A nearby 120-MW solar plant experienced terminal voltage drop to 0.7 per unit. The solar inverters immediately stopped generating and scaled down current output. The momentary cessation response led to an instant loss of 112 MW, which is undesirable for system operation. The event was captured by the fault analysis system and identified the solar plant that did not ride through fault in a preferable manner. The solar generator should be informed about such behaviors. Recommended corrective actions, such as adjusting solar inverter ride-through settings are prescribed, which will strengthen the grid’s resiliency to faults.
Solar Plant Model Validation
Solar plants need to be accurately represented in planning and protection studies. The plant models are used to evaluate system dynamic response, fault current strength, and protection coordination. For conventional generators, their dynamic responses are governed by physical laws and thus can be characterized by generic models. In comparison, the dynamic response of inverter-based generation is dictated by proprietary inverter controls and not well-known to the system operators.
In addition, modern inverters are highly adaptable and can be configured to various control modes in the field. Validating solar plant models against actual field response and ensuring they are meeting required performance are important for system planning and protection. Some common model validation studies are focused on inverter frequency response, voltage response, and fault response. Verifying that the actual response of the studied solar plant agrees with the simulation response, builds confidence in the system model. Model tuning is sometimes necessary when measurement and simulation do not match.
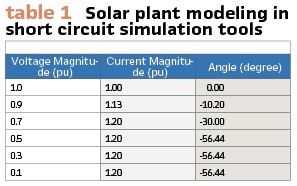
An example of solar plant short circuit model validation is shown below. In commercial short-circuit simulation software, solar inverters are modeled as voltage-controlled current sources. The fault response is characterized by a lookup table, where the fault current magnitude and angle are listed as a function of fault voltage magnitude. Such a table is typically filled with generic parameters like in Table I.
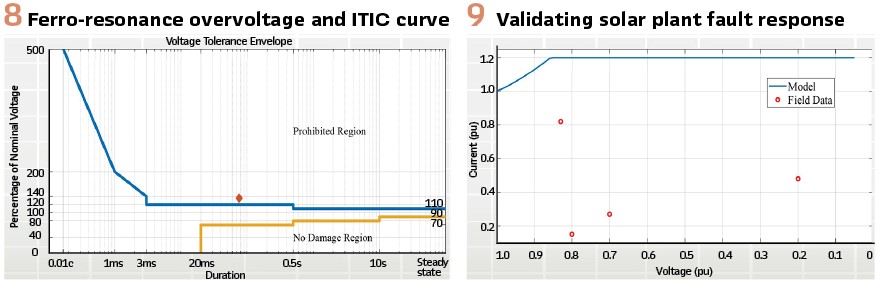
Actual solar plant solar fault response can differ from the generic model. Figure 9 shows the discrepancy between the generic response in blue and field-measured fault response in red. The fault current of the generic model plateaus at 1.2 per unit whereas measured fault current can be much less, as the pre-fault solar irradiation levels can have a direct impact on fault current levels. The discrepancy has implications on how much fault current is seen by utility relays. Incorrect fault representation may lead to protection coordination issues. By leveraging the historical data, one can continuously capture the fault response of a solar power plant and validate its fault response against modeling.
Power Quality Monitoring
Ferro-resonance overvoltage is an emerging issue at solar plants. This phenomenon typically happens after single-pole operation on distribution systems, leaving the open phase out of connection with the utility grid. The step-up transformer inside the solar plant can resonate with the circuit cable, creating ferro-resonance overvoltage on the open phase. The transient overvoltage can be harmful to the load equipment and utility devices connected to the affected circuit if a sustained overvoltage is present. Monitoring and mitigating ferro-resonance are therefore critical to the reliability of the distribution system and DERs.
Transient overvoltage can be captured by voltage level detectors or voltage harmonics triggers. The voltage thresholds and pickup timers can be configured per the ITIC (Information Technology Industry Council) curve, which was formerly know a the CBEMA (Computer & Business Equipment Manufacturer’s Association) curve. This curve provides an AC voltage boundary that most computer equipment can tolerate without unexpected shutdowns or malfunctions.
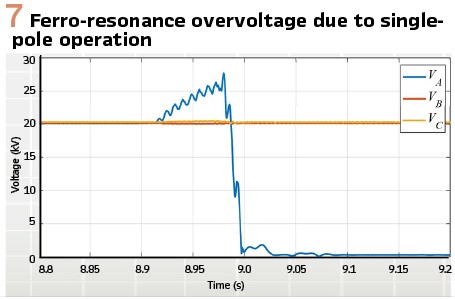
The ride-through capability curve is also widely adopted by other industry and utilities to ensure load equipment safety and power quality. By setting a proper overvoltage pickup criterion, ferro-resonance overvoltage can be captured. A sample overvoltage waveform is shown in Figure 7. It is noted that Phase C experienced open-phase conditions and ferro-resonance led to overvoltage with significant harmonic content. Its impact can be evaluated against the ITIC load damage curve. As shown in Figure 8, the overvoltage event can be characterized with its overvoltage duration and magnitude. The red diamond represents the severity of the voltage issue with regard to potential load damage. Since the event loci, which is at 135% of the nominal voltage and 76-millisecond duration, is located outside the tolerance boundary, such an event could interrupt a load. If this type of event is recurring at a solar plant, mitigation measures are needed to avoid future occurrences and equipment damage.
Conclusions
As renewable generation increases its footing in the electricity grid, so does the need for grid monitoring and data analysis. Improved visibility could help address the variable nature of solar generation while maintaining high reliability performance.
The described solar generation monitoring system has been successful in providing real-time situational awareness to system operators, capturing high resolution data for root cause analysis, verifying behaviors of inverter-based generation, and offering guidance for performance enhancement. The result is a well-monitored and protected solar fleet that is key to a resilient future grid.
Future Work
The advancement of renewable energy and data analytics offers abundant opportunities to increase system visibility and improve grid reliability. Much future work can be done to bring innovation in power system monitoring, modeling, and predictive maintenance, among others. Below are a few aspects for consideration.
Fault event categorization: taking an artificial intelligence approach to categorize fault events will provide real-time root cause analysis and guide field patrol and restoration. Methods such as convolutional neural networks are ideal for data clustering with minimal human intervention. The artificial intelligence approach is also capable of batch processing historical events, which can help identify hidden reliability concerns and suggest mitigation measures.
Data visualization: visualizing the operational data of solar generation, along with geographical information, will enable advanced analytics at various temporal scales. The capability opens doors for long-term solar fleet performance review and enhancement, resulting in optimized asset usage and reliable operation. A data processing and visualization solution will be beneficial.
Biographies:
Gefei “Derek” Kou is a senior engineer with Dominion Energy in the system protection engineering department. He works on transmission and distribution protection design and calculation, solar interconnection, and advanced data analytics. Kou studied the integration of renewables on large-scale power systems and earned his Ph.D. at the University of Tennessee, Knoxville. He is a senior member of the IEEE and holds professional engineer and project management professional licenses.
Penn N. Markham earned his B.S.E.E. from Virginia Polytechnic Institute and State University (Blacksburg), and his Ph.D. in electrical engineering from the University of Tennessee. From 2013 to 2017, he worked in the Grid Operations and Planning research program at the EPRI in Knoxville, TN, where he developed several software applications related to load modeling, risk-based planning, protection, and frequency response. Currently, he is a member of the Distribution Grid Planning group at Dominion Energy in Richmond, VA. His research interests include wide-area measurement systems, energy storage, power systems simulation, and data analytics.
Thomas J. Purcell is an Engineer III at Dominion Energy where he works in System Event Analysis Engineering, doing transmission event analysis, event analysis automation and fault recorder maintenance. He has an undergraduate degree in Electrical Engineering from Virginia Tech, a master’s degree from Old Dominion University in Systems Engineering and is a Licensed Professional Engineer in Virginia.
Ariel Valdez is a senior engineer with Dominion Energy in distribution reliability. He has more than 15 years of power system experience in various engineering and operational roles. Currently, he is involved in DER integration standards, power quality and reliability. Valdez earned his BSEE degree from Virginia Polytechnic Institute and State University in 2008 and is a professional engineer in Virginia.
Philip VanSant is a professional electrical engineer with 14 years of utility experience. He has a BS in Electrical Engineering from Virginia Tech. He has a mix of experience in Transmission System Operations, Transmission and Distribution System Protection. He also helped develop Dominion Energy’s DER interconnection project requirement document. Philip is currently the supervisor of Dominion Energy’s Transmission System Protection Engineering group.