By Nolasco Orrego, XM S.A. E.S.P., and Felipe Quintero, Universidad de Medellín, Colombia
Colombia Interconnected Power System (CIPS) is an HVAC system and has an installed capacity of 16,900 MW approximately. Around 86% of the total electrical generations come from a hydro generation, 13% from thermal generation and 1% from other sources. The CIPS has 6,662 miles of transmission lines at 115 kV; 7,897 miles at 230 kV and 1,575 miles at 500 kV. The CIPS has another 6 international interconnections, each at 230 kV: two with Venezuela and four with Ecuador.
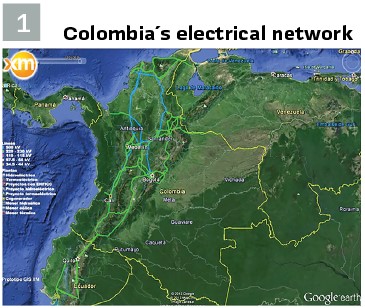
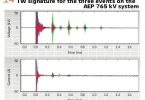
The CIPS frequency is 60 Hz; the normal operation voltage band is between 0.9 p.u to 1.1 p.u; the common mismatch between load forecast and real load is around ±5%. (See Figure 1). The bulk power systems are vulnerable to electric disturbances that may threaten the correct performance of the electricity service. Due to the tropical nature of Colombia, the country is susceptible to lightning strikes which increases the risk of electrical disturbances. To protect the Electric Power System (EPS) against these phenomena, devices such as relays and circuit breakers are implemented in the grid. Those devices eliminate faults and prevent the EPS from collapsing.
Once electrical disturbance occurs in the CIPS, the Substation Automation System (SAS) generates the Sequence of Events (SOE) file. Also, the Digital Fault Recorder (DFR) and the relays store the electric disturbance information in COMTRADE files. Those files, SOE and COMTRADE, are sent from the transmission’s assets facilities to XM, taking up to five business days to arrive. Then, XM has another 13 business days to perform a disturbance analysis report from this data.
To increase the security and reliability of the CIPS operation, XM has carried out several studies and research whose main objective is to reduce the time of the disturbance analysis report, from 13 business days to minutes. These several studies have been covering from a revision of the Colombian electrical regulation to international technological surveillance on the state of the art of the automatic analysis of failures in electrical power systems. XM has been working to propose a scalable solution to disturbance analysis processes in other Transmission System Operators (TSO). This article presents a summary of this research and proposes a new methodology for the automatic disturbance analysis at the CIPS.
Technical and Juridical Concepts
Although the electrical operation of the CIPS is carried out in compliance with all the regulations defined for this purpose, whose goal is to preserve the security and reliability of the system to supply the electrical demand, there are some aspects related to fault disturbance analysis process that affect the system security. Those aspects are listed below:
1. Slowness to provide information, such as COMTRADE files, used to analyze electrical faults on the power system. In Colombia, the TSO must supply this information. This time delay can reach up to five business days. This aspect generates a huge risk that threatens the security and reliability of the CIPS operation.
2. Oscillographic records, coming from the same substation or end substations, are not time-satellite synchronized.
3. Non-standard oscillographic records. Although in 2013 the Institute of Electrical and Electronics Engineers (IEEE) and the International Electrotechnical Commission (IEC) published the international standard IEC 60255-24: 2013 (IEEE Std C37.111) related to COMTRADE format, in Colombia, the names of analog and digital channels used to record electrical variables (e.g. current and voltage phasors) and digital protection actions, are not standardized. Therefore, different names can be found for the same channel, analog or digital, when the COMTRADE files are supplied by any TSO. This causes considerable delays in the analysis of the disturbances. This aspect hinders any automation proposal.
4. Manual analysis of COMTRADE files related to DAEPS. XM has 13 business days to perform a disturbance analysis.
The disturbance analysis process in CIPS is divided into 7 stages. Figure 2 shows the deadlines.
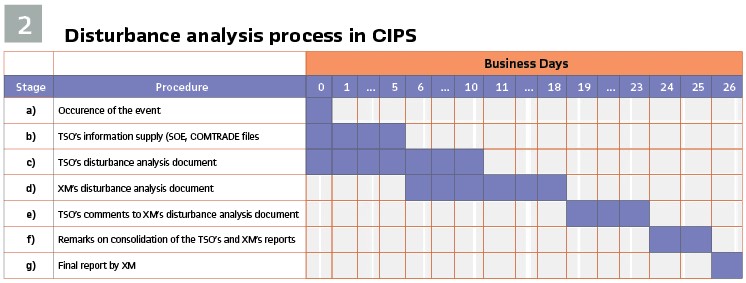
a) occurrence of the event; b) Determination of inputs: reception and organization of the data and reading of the technical report of the agents, electrical operational information provided by the CND, reference of the electrical protections; c) Analysis: data processing, hypothesis statement, gathering and consolidating evidence; d) Results: determine the root cause of the event, present the performance of protection systems; e) propose corrective actions: conclude, present solutions, actions, and recommendations to the agent; f) Publish the report; g) Follow up.
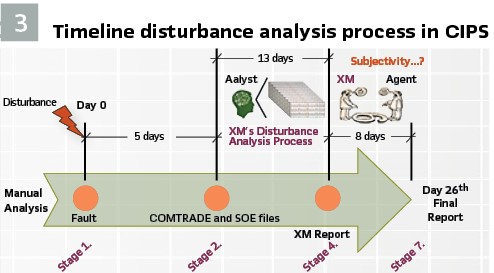
The timeline, Figure 3, allows understanding better the delays associated with the disturbance analysis process in CIPS.
Economic Viability
To determine the economic viability savings by implementing an automation disturbance analysis process, a hidden costs study was carried out. The meaning of hidden costs are expenses not attributable, directly or indirectly to any element, and they can be calculated as the difference between the time on production and selling.
These costs are similar to inventory costs. However, in this case, the costs are unidentified for the process because it is not a tangible asset and exists a difference between the time of the performing and reporting of the event analysis.
To estimate the hidden costs, related to the manual disturbance analysis process in CIPS, the following process was carried out:
1. Determine the average CIPS events per year and its complexity: From 2015 until now, XM has been made of 2873 fault disturbance analysis. Table 1 shows the amount of disturbance analysis per year.
Where:
- AEYCIPS: Average Events per Year in CIPS.
Not all disturbance analysis reports from XM take 13 days to be prepared. To establish which fault reports are made in 13 business days and which in fewer, the XM’s analysts had to classify the failure analysis reports according to its complexity. Table 2 presents these ranks.
2. Estimate the average time that one analyst invests in the manual fault analysis: for this purpose a survey was prepared under the Delphi method. The survey consisted of five questions. Four questions were made to estimate the total time which it takes to perform the fault analysis, and the last question was made to establish which stage, of the elaboration of the failures report, takes up most time. The questions were:
a. When a fault analysis is assigned to you, regardless of the complexity of the disturbance, what percentage time, per business day, do you spend to develop a fault analysis report?
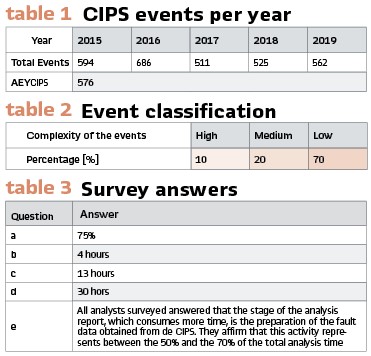
b. If you have considered that the disturbance was a low complexity fault, how much time in hours does it take to perform the full report?
c. If you have considered that the disturbance was a medium complexity fault, how much time in hours does it take to perform the full report?
d. If you have considered that the disturbance was a high complexity fault, how much time in hours does it take to perform the full report?
e. In your opinion, which stages of an analysis report were most time-consuming, and, what percentage of the total time does this activity represent?
The results are presented in Table 3.
Based on the fault disturbance complexity, we have calculated the weighted average time (), in hours, that an analyst would take to perform an event report.
3. Fix the weighted average time () by turning the dedications days into business days: To estimate the TCEAPP variable, it is necessary to know the total business days that an analyst, of EAPP, has been working per year. The result is 226 after discounting weekends, 18 holidays, 15 days of vacations, and 5 days of disability on average.
4. Hidden Costs (HC) of the manual disturbance analysis process: Finally, we calculated the total hidden costs of performing the Disturbance Event Analysis manually, which is around 547200 USD/year.
Automation Methodology Proposal
To automate the event analysis process at XM, we propose to develop a software which contains 4 modules: a) CIPS’s Fault Identification Module, b) Classification Fault Analysis Module which uses AI methods, c) Protection Relays Performance Module and, d) Information Storage Module and Cloud Connection. Figure 4 presents a proposal architecture.
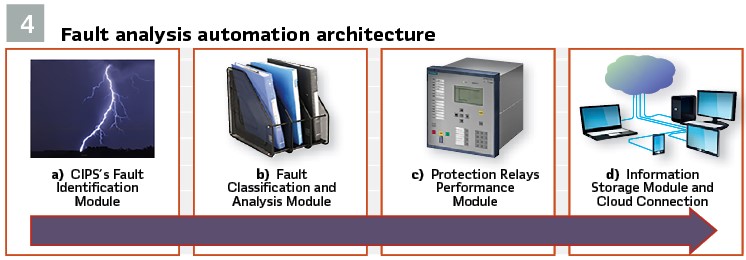
The purpose of each module is to increase the speed and accuracy of the disturbance analysis and perform the report. Each module is described below:
a. CIPS’s Fault Identification Module: The TSO has 5 days to send to XM, all disturbance data like COMTRADE and SOE files. This module focuses on identifying the moment of fault occurrence in CIPS and will immediately request from the TSO disturbance data. The information is expected to come, to XM before the end of the first minute following the time of the failure.
b. Fault Classification and Analysis Module (FCAM): At first, it will contain three applications. The first one will organize and classify the SOE and COMTRADE files of each fault through RPA software. This system must identify the files by their name and organize them in folders, it must facilitate the recognition of the files related to a specific fault, it must bring a simple and intuitive search to ease the disturbance analysis.
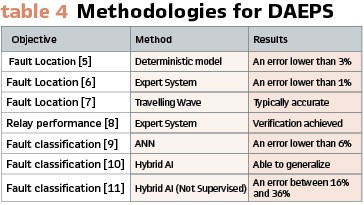
Once the COMTRADE and SOE files are gathered and organized, this module will perform a disturbance analysis by determining the classification and fault location. During the literature review, used to carry out this work, technological surveillance of state of the art of different applications were performed in the analysis of electrical disturbances. We found different methodologies applicable to the process of automation of disturbance analysis at XM. In Table 4, featured papers are presented, classified by objective, methods, and results.
The low errors in the methodologies found show the viability of automating the event analysis. Therefore, the methodologies for each automation goal proposed are:
- Fault classification
Through an artificial neural network (ANN), the system will determine the classification of the fault. The proposed ANN will be divided into four different ANNs, one for each phase (R-S-T-G). The output of each ANN will be an activation-deactivation signal (1 or 0). Hence, the combination of activation-deactivation signals will translate through a rule-based system into a type of fault. For the training of the neural network, it is proposed to use the XM’s disturbances database by classifying each event in faults types, so supervised learning can be carried out. The learning algorithm used will be the error backpropagation method. However, the usage Support Vector Machine, Clustering, or any other methodology is encouraged in case of improvement.
- Fault location
The fault location will be a combination of different techniques performed by three systems:
1. Expert System described by Yuehai et al., which proposes an expert rule-based system for the analysis of faults in power systems. To do this, it uses a hierarchy, which is as follows: the substation layer and its electrical equipment; the support system layer with communication and information storage mechanisms; software layer, where is the failure location algorithm and a simulation system for topology analysis and computation of the failure. With this scheme, errors between 6.2% and 0.4% were obtained in the fault location software.
2. Artificial intelligence proposed by Calderon et al. where they designed a neural network for fault classification in transmission lines using COMTRADE records. To carry out this objective, a neural network with Bayesian regularization learning was proposed. Through ATP simulations, the network was fed for learning and validation. The neural network architecture used was that of a multilayer perceptron with 1 hidden layer of 12 neurons. The first layer consists of 7 neurons with the inputs of each of the analog voltage and current signals. The output layer has 4 neurons with binary values indicating the failed phase and the inclusion of the ground. The hidden layer had 12 neurons resulting from optimization of the error and generalization of the model.
The activation functions taken were tansig for the hidden layer and purelin for the output layer. Two learning methods were used, Bayesian regularization and early completion. The results obtained show errors of less than 1%. However, it is possible that the use of an ATP model to obtain data shows an overfit and therefore have such low verification errors.
3. A 3-layer neural network was used, where the input layer consisted of 4 neurons, relative to active power, reactive power, resistance and reactance. The hidden layer consists of 50 neurons. Finally, the output layer with two neurons, one related to resistance and the other the location of the fault. The sigmoid tangential transfer function between the input and the hidden layer was used, and a pure linear transfer function between the hidden and output layers was used. The initial conditions were established based on the Nguyen-Widrow method for the terms of bias and weights. The training used was the Levenberg-Marquardt method, which is an improvement on the original Newton method, this method is more powerful than the classic gradient descent method used in Back Propagation. The calculated error percentage does not exceed 6% in the tests carried out.
With those three methods, we propose the following architecture (see Figure 5) for the fault location module.
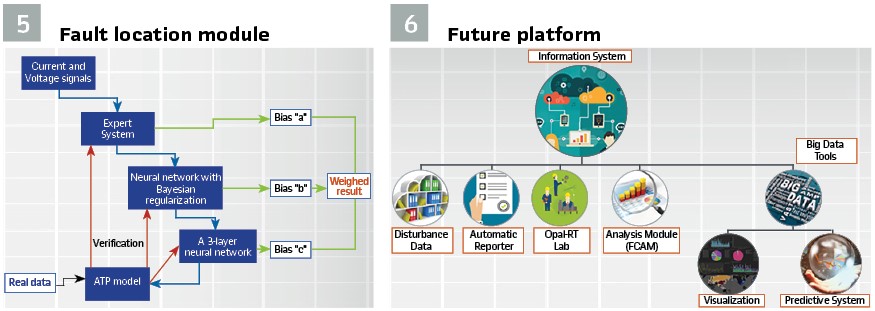
The idea of this method it is to adjust the model constantly by comparing the results of each method with the ATM model and the real fault location and assigning bias to calculate a weighed result of fault location. Future work must aim to enhance the learning method to increase its efficiency.
c. Protection Relays Performance Module: In this module, a system of expert rules and fuzzy logic is proposed for the analysis and comparison of SOEs and digital signals of the COMTRADE file. However, as mentioned in publications, the methodologies of “Fuzzy Reasoning Petri-nets” (FRPN) have an advantage and allow diagnostic models of protection performance.
Also, it is encouraged the usage of CIPS models to simulate the system and evaluate the theoretical operation of the protection relays, and then compare it with the real performance.
d. Information Storage Module and Cloud Connection (ISMCC): This module will be an RPA software. The results and data obtained from the previous modules will be stored and organized in data lakes for Big Data.
Future Work
Nowadays, XM has been developing a prototype of module b, that classifies the fault according to your type and provides its location with very good results, but this will be presented in a later paper.
Future work should focus on implementing this system at XM and integrating it with multiple tools to transform this software into an Information System. In the future, XM will have a system which will take the TSO data from the cloud, it will perform event analysis and create the report document, it will integrate Big Data tools with predictive systems and visualization mechanisms, and finally, it could take the historic information to perform laboratory tests (OPAL-RT) and maintenance management. Figure 6 shows the future platform.
Conclusions
The technical, economic, and legal viability for automating the event analysis process has been demonstrated in XM. Besides, the applicability of the modules proposed for disturbance analysis has been demonstrated through the prior State-of-Art review. Also, this automation methodology will save XM, in one year, an estimated value of 547200 USD in hidden costs. It will not mean that XM will earn or save this money directly, but enhanced awareness of the distribution of the costs. Hence, there will be 0$ hidden costs, and now, these known costs can be managed.
However, there will certainly be direct saving of workforce hours which could be used for other activities. The aim of this article is not to determine this direct saving, but future work can take this issue in consideration for economical calculations.
Finally, the automatic analysis and disturbance reporting will increase the reliability of the CIPS.
Biographies:
Nolasco de Jesúus Orrego Palacio, Electrical Engineer from Universidad de Antioquia. He obtained a master’s degree in Engineering in Electrical Power Systems at the Universidade Federal de Santa Catarina, Brazil in 2000. Since 1995 he joined with Interconexión Eléctrica SA (ISA), where he worked as Analyst for the control and relay protection Department. In 2005, he was transferred to XM as a Planning Specialist. He has significant expertise in the areas of maintenance as well as in the areas of electricity and energy planning, Operation of Power Systems, and electrical protection.
Felipe Quintero Suarez, Energy Engineer from the Universidad de Medellin, a member of the Renewable Energies Research Group from the Universidad de Medellin. He has experience as Energy Auditor and intern as Power Systems Research Engineer at XM. He has research papers and patents. Finally, he has attended events like the 7th Latin American Energy Economics Meeting, 7th International Workshop of the Journal of Cleaner Production, 5th Meeting of Young Researchers on Energy Engineering of Sinaloa State as a speaker.