by Sean McGuinness, EPRI Europe DAC, Dublin, Ireland

Large language models (LLMs) have received a lot of public and industry attention since the launch of ChatGPT 3.5 in November 2022. Their capabilities and performance have been widely discussed – experience has ranged from shockingly good down to entertainingly bad. At EPRI, we have been working to investigate the practical applications of LLMs and present unbiased and independent results to the industry. This article focuses on our experience developing test protocols to evaluate four off-the-shelf, commercially-available large-language models (LLMs) and their potential value to assist protection engineers. The LLMs were not custom-trained: they were the regular “pro” or “plus” versions of products.
The objective of the work was to assess whether off-the-shelf LLMs have the ability to interpret protection drawings, relay manuals, grid models, and settings guideline documents necessary to configure overcurrent, distance, and differential protection relays. The failures were often more interesting than the successes.
The LLMs are not named in the test results as their capabilities are advancing very rapidly, so any review would be quickly out of date and potentially unfairly discriminate.
The LLMs were tested using their web browser chat interface. When performing research on LLMs there are typically two types of prompts used: research prompts and production prompts. Research prompts are used to test and investigate the knowledge, capabilities, and limitations of an LLM, while production prompts are used to perform work or actual tasks. Research prompts are usually simple, clear questions that are used to help understand how the LLM works, its understanding, and knowledge. For example, a research prompt might involve asking an LLM if it can calculate a distance protection zone reach given transmission line impedance. Production prompts are more like scopes of work for more complex tasks (like configuring many different functions in a relay). This article focuses on research prompts, but the learnings can be used to create production prompts.
Single Line Diagrams and Functional Specifications
In this test, the LLMs are given typical examples of single-line diagrams and protection functional specifications. They are tasked with extracting relevant information that is required to configure the protection relays.
In the first task, the LLM is given a technical specification for a fictional transmission line upgrade. It is a 22-page report for a substation which specifies protection requirements, communications, SCADA requirements and signal definitions, time-synchronization, geographical maps, and so on. It contains data in the form of text, tables, and images. The file format aimed to replicate real documents, but no real data or site-specific information was used for data security reasons.
The objective of this test is to determine if the LLM can extract key information and recognize what the information signifies. Each LLM was given the document as a Microsoft Word file and asked to extract specific information and provide a technical explanation of each. The LLMs were each able to extract the substation name, cubicle name, and other location information relevant to the relay location on the grid as well as protection and control information like CT and VT ratio and class, the number of protection relays required, the manufacturer and model of each relay, the protection functions used in each relay, and the type of communications used and which channels are used for each protection relay and function. The key point is that the LLM is not just parsing the document like a regular search function but can give meaning and context to each of item. This is important later when it is tasked with configuring the relays.
In the second test, a set of generic Single Line Diagrams (SLDs) were created ranging from simple single-bus, two-line stations up to 1.5CB stations with 12 lines and transformers. The SLDs were given to the LLMs in PNG image and PDF file formats. The LLMs were asked to extract information for a specific, named bay (e.g. “400 kV Line #2”) and also to repeat the task for every bay they found the SLD. They were also asked to provide a technical explanation of what each parameter meant (what does CT burden mean) and the significance of the value (what does a CT burden of 5 VA tell us). They were requested to return information such as station name, busbar topology, CT, VT, CB, relay information, and communications information for each bay, as well as rating, winding types, and impedance of any transformer.
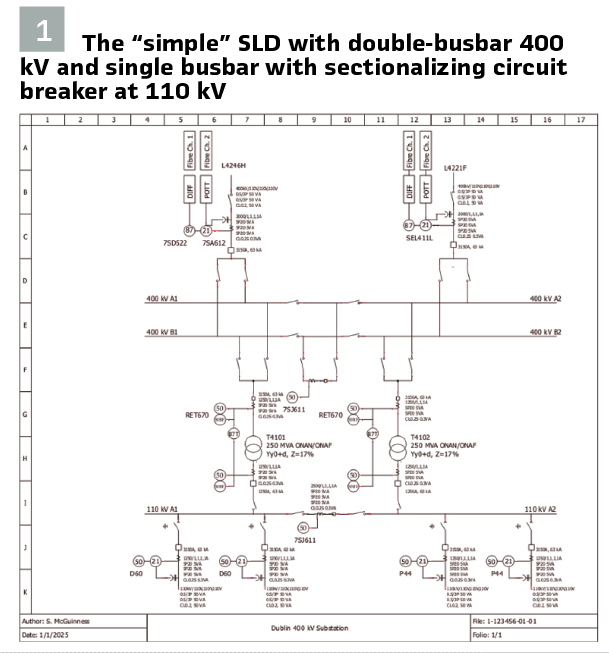
This test was challenging for the LLMs. None of the LLMs were able to consistently identify the busbar topology. For example, when given a 1.5CB busbar they would say it was a double busbar. The performance improved when they were given a description of what the different topologies looked like.
Two of the LLMs were able to correctly identify lines by name and voltage and could correctly extract CT and VT ratio, burden, and class from the diagram. They returned the correct values both where the data was beside the CT and VT device in the drawing and where the CT and VT information was stored in a table at the side of the diagram. One LLM returned a valid identifier, but for the wrong line. The same LLM returned the VT information for the wrong voltage level (e.g. 110 kV device when it was asked for information for a 400 kV line). This shows it was able to extract the information but not associate it with the correct location. None of the LLMs fabricated values or hallucinated results.
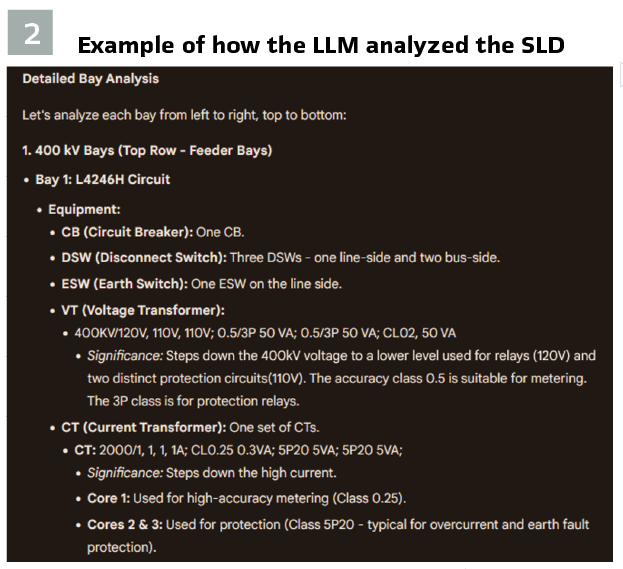
These tests found that some LLMs performed very well, but none were without errors. Accuracy and reliability could be improved by additional training and more detailed prompting and guidance. (Figures 1 and 2).
Grid Models and Simulation Output
In order to calculate protection settings, the LLM needs access to asset information and simulation results. The objective of this task is to assess whether the LLMs can read the grid model files used by common short circuit analysis software and interpret simulation output or print-outs from short circuit simulations. Two grid models were used for this test: a 39-bus system and a 570-bus system.
Extracting Information from a Grid Model
Most short circuit simulation tools have the ability to save grid models in a text file format. This text file contains information about every busbar, transmission line, transformer, generator and so on. In this test the LLMs were given such text files and asked to extract grid information such as asset information and impedance.
An important part of this test was to determine if the LLMs could recognize different topologies such as tapped, multi-section, and mutually coupled transmission lines as well as the impact of transformer windings on zero sequence impedance.
Multi-section Transmission Lines
In this test the LLMs were asked to provide the total impedance between two busbars. The circuit between the busbars consisted of two transmission line sections with an intermediate (fictional) bus/node. The LLMs were not told that the circuit consisted of multiple sections. The two busbars were also connected via a second, longer path through the rest of the power grid, but that path consisted of two separate transmission lines and real busbars. Thus, this test determined if 1) the LLMs could distinguish real busbars from fictional ones, 2) whether they could trace out paths between busbars, and 3) whether they could calculate the total impedance of multiple transmission lines. Three of the four LLMs correctly identified that two paths existed between the two busbars. They correctly calculated the total impedance of the path via the fictional bus. All three also decided to calculate the impedance of the second path, but one got confused and included the impedance of a load transformer connected to one of the busbars. The LLM which failed the test picked the correct path, but only returned the impedance for the first section.
Transmission Line with Tapped Transformer
In this test, the LLMs were asked to provide the total impedance between two busbars. The circuit consisted of two transmission lines with an intermediate node with a tapped delta-wye transformer.
The LLMs were asked two questions 1) to provide the impedance between the two busbars at the ends of the transmission line and 2) to provide the impedance between one of the transmission busbars and the bus on the MV side of the tap transformer considering the winding configuration.
Three of the four LLMs correctly extracted the impedance of the transmission line and transformer and accounted for the delta-wye transformer winding connection when calculating the zero-sequence impedance. The LLM which failed the test did not pick the correct transmission line and did not look for the transformer.
Relative Transmission Lines
In this final set of tests, the LLMs were tasked with calculating the total impedance of a transmission line plus the shortest or longest transmission lines connected to the near-end or remote-end bus. This question required the LLMs to understand which busbar was “near” and which one was “remote”, while also interpreting which was the “longest” and “shortest.”
Three of the four LLMs correctly interpreted “near-end busbar,” “remote-end busbar,” “shortest line,” and “longest line.” The LLMs all used positive sequence impedance as the metric for length without being told. They also ignored transformers at the remote-end busbar, focused on transmission lines at the same voltage level, and calculated the total impedance. The LLM which failed the test chose the incorrect starting line and did not choose the correct busbar as “remote” or “near.”
From this analysis we can see that several LLMs demonstrated the capability to correctly interpret power system models and the positive and zero sequence networks used for short circuit analysis. The tests were repeated for the larger grid model with similar results. It is noteworthy that when this test was originally performed in mid-2024, only one LLM could successfully analyze the model. By late 2024 two more LLMs were able to perform the task.
Interpreting Simulation Results
Most short circuit analysis tools print simulation results in text format to a message window. Each tool has a unique default format stating fault location, fault type, phase currents and voltages, sequence currents and voltages, Thevenin equivalent circuits, and X/R. They may also include protection trip times, coordination margins, and other relevant information. Figure 3 shows a typical example from Siemens PSS-CAPE.
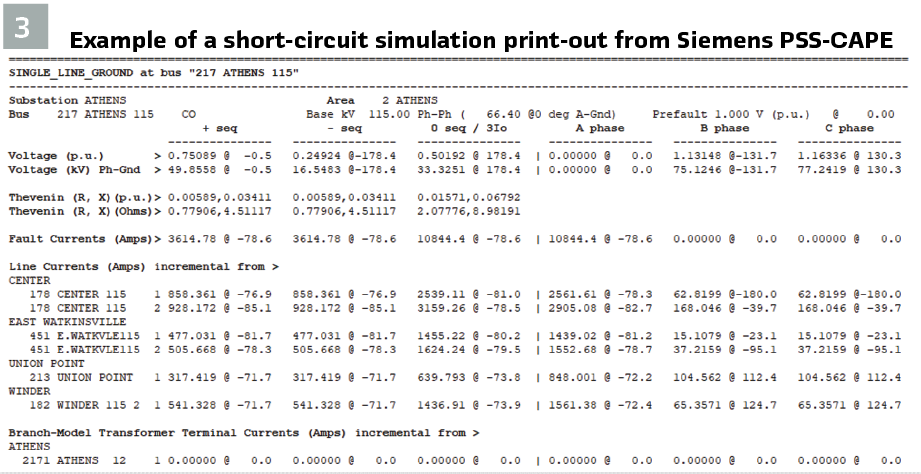
The purpose of this test is to assess whether LLMs can directly understand these simulation results and extract key parameters. This is a key task for calculating protection settings and performing related tasks such as breaker duty rating studies or CT saturation checks.
Four tests were performed by running three-phase and single-line to ground short circuit simulations on a busbar and at 20% along a transmission line. The simulation print-out was copied from the message window and manually pasted as a prompt into each LLM. The LLM was asked to determine:
- The fault location and type
- The phase current magnitudes and phase angles
- The phase voltage magnitudes and phase angles
- The positive and zero sequence current magnitude and phase angle
- The positive and zero sequence voltage magnitude and phase angle
The testing found that all four LLMs successfully extracted all of the short circuit parameters for all bus and line faults. In all cases the data was reported in a well-formatted manner with headers and correct descriptions and units for each parameter. One LLM incorrectly interpreted the midline fault – it reported it as a bus fault rather than a distance along the line. The other three LLMs correctly interpreted the distance to fault from the near bus to the remote bus.
Calculating Protection Relay Settings and Verifying Performance

In this test the LLMs were asked to calculate site-specific settings for distance, differential, and overcurrent protection relays. The test does not aim to replicate the work of senior technical experts who create the relay settings template based on utility practice and lab-testing of each relay. Instead, it is aimed at the routine task of setting a relay for a typical new or upgraded transmission line. The LLM is provided with a small grid model, short circuit simulation print-outs, a settings guide or philosophy, and a description of relay functions and settings similar to the information provided in a relay manual. For each test, the LLM was asked to configure the protection relay and create documentation showing its work. The relay settings guide provides rules and guidelines for the LLM to follow. This is short set of rules intended to determine if the LLM can use the correct rules for each setting, extract the correct data, and detect conflicting or ambiguous requirements:
- Zone 1 set to 85% of the line impedance and no time delay
- Zone 2 set to 120% of the line impedance and time delay of 0.3 seconds
- Zone 3 set to 70% of the impedance of the shortest line in the reverse direction and a time delay of 1 second
- The load encroachment blocking function should be calculated based on 150% of the largest rating at a voltage of 0.9 pu and a power angle of 30 degrees
- On lines with mutual coupling to a parallel line, a Zone 1 reach of 75% of line impedance and Zone 2 reach of 200 % of the line impedance should be used
- On lines shorter than 2 km, Zone 1 should be disabled
- Permissive over-reach transfer tripping (POTT) should be enabled using Zone 2.
- Switch-on-to-fault overcurrent should be 80% of the close-in three-phase short circuit fault level, but should be greater than the line rating.
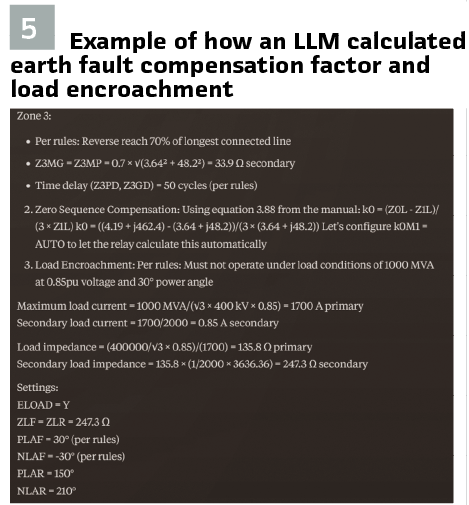
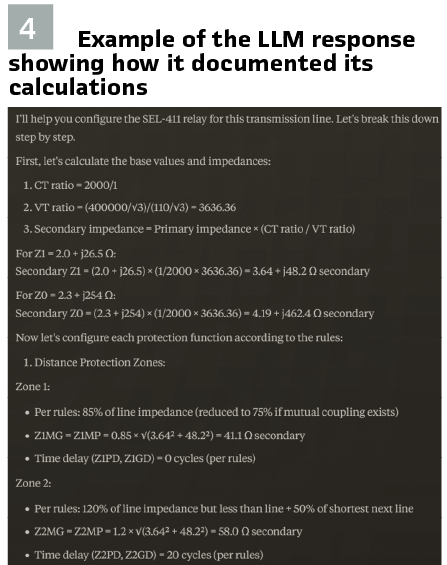
Note that the settings guide does not specify how to calculate the earth fault compensation factor, load encroachment blocking, and certain other settings – this was a deliberate choice to determine if the LLM would use the relay manual or its own knowledge to figure out how to convert the given data into the correct format for the relay.
Basic Transmission Line Protection Settings
In this test the LLMs were asked to calculate settings for a new transmission line. It is a simple, 400 kV single-section line 100 km long with an impedance of Z1=2.0+j26.5, Z0=2.3+j254 ohm and 1000 MVA rating. This test can determine if the LLM can correctly extract the relevant grid data, calculate zone reaches, convert impedance between primary and secondary values, time delays, earth fault compensation factors, and other parameters.
For those LLMs that could extract the line impedance from the grid model, two were able to correctly calculate the earth fault compensation factor, zone reaches and choose the correct time delays.
One LLM chose the correct equation to convert from primary to secondary (relay) impedances but incorrectly applied it. It multiplied the primary impedance values by the CT Ratio divided by VT Ratio instead of the VT Ratio divided by CT Ratio. When the LLM was informed about the error, it correctly applied the equation in all subsequent tests in that chat.
This shows the value of research prompts to identify LLM flaws – once we know the LLM gets something wrong, we can prevent the error in the future by including the rule as a line item in the relay settings document. The LLMs were able to explain the purpose of each protection function and how it calculated each setting. (see Figures 4 and 5).
One LLM applied the correct logic to implement POTT in the relay, with Zone 2 pickup being used to trigger a POTT transmit command to the remote end relay and Zone 1 or Zone 2 along with a POTT receive command used to permit tripping. Another LLM created the logic equation for POTT scheme, but it incorrectly used the output from Zone 2 trip instead of Zone 2 pickup. While this mistake is simple to identify and correct, it is a good example of how knowledgeable and creative LLMs can be. If the LLM had gotten the logic correct, it could easily be assumed that it just learned that logic during training and simply copied it from the internet. The fact that it had the right idea, but chose the wrong input signal suggests it was trying to create the logic itself.
Double Circuit and Tapped lines
The double-circuit test determines if the LLMs correctly identify that the line is mutually coupled to a parallel circuit and that it should apply a different settings rule for Zone 1 and Zone 2.
Only two of the LLMs were able to identify the double circuit and apply the correct settings rule. The tapped-line test determines if the LLMs could correctly identify the path between the two busbars and add the impedance of each line section before calculating the zone reaches, while correctly considering the transformer circuit.
Three LLMs successfully identified tapped transformers and correctly calculated the settings. The other LLM did not correctly follow the path between the busbars.
Conclusion: LLMs were tested to evaluate their ability to understand SLDs and grid models and their ability to follow settings guidelines to configure protection relays.
The tests found mixed performance with SLDs, but excellent performance extracting information from text files and grid models. Several of the LLMs tested demonstrated surprising ability to understand grid topologies and the impact of transformers on zero sequence impedance.
During these test results, several LLMs demonstrated a surprising ability to calculate relay settings in complex scenarios. They also demonstrated an ability to use relay manuals and other sources to solve problems without the user giving explicit instructions. In real-world tests, LLMs can tested in parallel with existing relay setting processes – they use the same input documents and information as engineers – so it is a relatively low effort to determine if they work well with your company processes. Unlike other technologies, however, you can ask it to explain itself if it does something unexpected. Consider the time that could be saved if a protection relay explained why they failed a commissioning test or why they misoperated!.
Protection engineers will remain responsible for the successful performance of their protection systems. As power grids continue to become more complex, however, LLMs may be able to offer more intelligent, self-documenting, and interactive assistance to protection engineers compared to traditional spreadsheets and tools. There are interesting times ahead.
Biography:

Sean McGuinness has a BSc and MSc degrees from University College Cork. He is a Senior Technical Executive in the Transmission and Distribution Grid Operations Department at EPRI Europe. Sean has spent the last ten years leading grid protection studies R&D at EPRI with specific focus on grid modeling, protection performance during dynamic events, wide-area protection studies, and grid protection applications of AI. He has also supported and lead many major blackout investigations for grid owners and operators, regulators, and power plant owners. Prior to EPRI, Sean was principal power quality and protection engineer at EirGrid, the TSO in Ireland, where he led many projects including the design and deployment of the WAMS system.