by Paul Hodges, Tampa Electric, USA
Acknowledgment: The author would like to acknowledge and thank Jai Subbarayan at Schweitzer Engineering Laboratories Inc. (SEL) for his assistance and guidance early in the event review process.
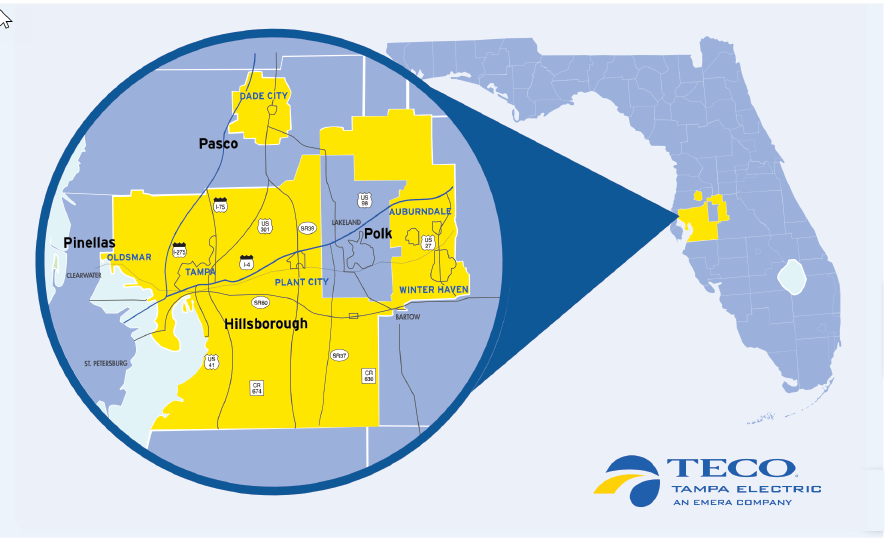
The Event: On Saturday, August 3, 2024, at 13:06:25, a windy day (one day before Tropical Storm Debby passed approximately 100 miles offshore), Tampa Electric experienced a trip of a 138/69 kV autotransformer and two 138 kV circuits in SUB A. Evidence from insulator burn marks, debris found within the substation, and relay event data indicated that an aluminum coated insulation panel landed on the transformer side of a 138 kV ring bus circuit breaker’s disconnect switch. This contact caused a 20-kA line-to-ground fault. Based on the fault location, the transformer’s Primary & Backup relays operated correctly on differential protection.
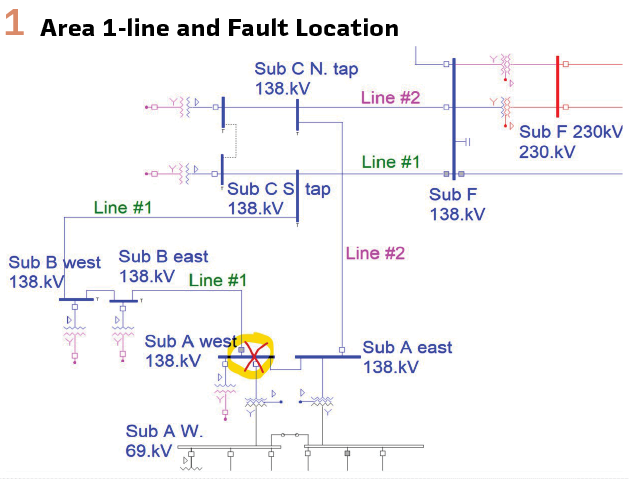
However, both 138 kV lines (Line #1 & Line #2 in Figure 1) mis-operated. They tripped solely by receiving a Direct Under-Reaching Transfer-Trip (DURTT) signal from the remote end of the lines. The Zone 1 (no-delay) DURTT elements were designed to reach only 80% of each line’s impedance, yet both protection systems operated for the fault located effectively at 100% of the line. The initial investigation confirmed that DURTT Zone 1 elements appeared to be calculated correctly, so the reason for the overreach was not immediately apparent. As a precaution, the DURTT Zone 1 reach settings for both circuits were temporarily reduced from 80% to 65% to prevent additional undesired trips while the root cause was investigated. Over the following six weeks, a detailed investigation was conducted to identify the causes of the mis-operations. Both typical and non-typical issues were reviewed (Figure 1):
- Were the relay CT/PT ratios correct? Yes
- Were the relay zone reaches calculated correctly? Yes
- Were the line impedances up to date & calculated correctly? Yes
- Were there other settings problems? No
- Were there indications of CT saturation or a bad PT? No
- Is the surrounding area modeled correctly? Yes
- Is the line impedance incorrect due to OPGW static wires? No.
- How important were high SIR issues? Important but did not fully explain trips.
- Should the two lines parallel sections have mutual coupling modeled? No
- Was there something different about the new relay’s settings we missed? No
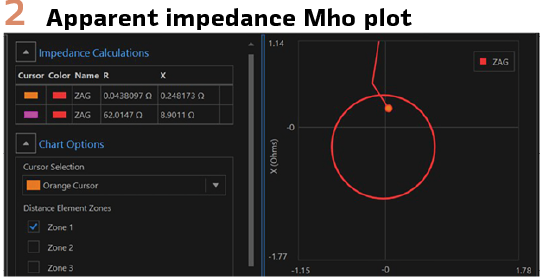
Because both the Primary and Backup relays at the remote end (SUB B) calculated unusually low apparent impedances, relay malfunction was considered unlikely as the cause. However, the relay manufacturer was still consulted to review the event data to see if they could spot anything that was missing. They pointed out that the calculated apparent impedance in the worst line (Line #1) dipped as low as 46% before the fault cleared (Figure 2). According to the relay manufacturer, high Source Impedance Ratio (SIR) combined with transient Capacitor Voltage Transformer (CVT) behavior likely contributed to the overreach for approximately one cycle. However, they expected that there were impedance modeling errors to blame in addition. (After the SIR/CVT transient issue settled out after about one cycle, the apparent impedance on the worst line only increased to around 63% of the given full line impedance.) Their estimated fault SIR was around 6, whereas the short circuit model suggested a SIR of about 3.3 at the remote terminal for line-to-ground faults. High-resolution event records did not provide any additional clues (like CT saturation etc.)
SIR-Source Impedance Ratio
High Source Impedance Ratio conditions occur when nearby system interconnections and sources are limited and when transmission lines are long and exhibit relatively high impedances. Under these conditions the available fault current is reduced, and the corresponding fault voltage is also lowered. Lower voltages also increase the errors in Capacitor Voltage Transformers (CVTs) measurements. Relay distance protection uses the fundamental relationship Z = V / I (from Ohm’s Law). When fault voltage is depressed due to high SIR, even modest transient errors in Capacitor Voltage Transformers (CVTs) or in measured current can produce artificially low calculated impedances, especially during the first few cycles of a fault.
In Tampa Electric’s system, high SIR conditions have been uncommon because most of the transmission network is in urban areas with strong sources and relatively short line lengths. However, this event occurred on the 138 kV subsystem, which is a relatively small electrically isolated island supplied by a few autotransformers. As a result, the effective SIR in this area is significantly higher than in the rest of the system. In this event, the high SIR contributed substantially to the drop in the apparent impedance observed at the remote-end relays.
Inverter-Based Resources (IBRs) generally contribute limited fault current, and their locations are often distant from load centers, connected by long transmission lines. As the power system integrates an increasing number of IBRs and retires traditional synchronous generators, system strength will continue to decline. This trend makes higher SIR conditions more common.
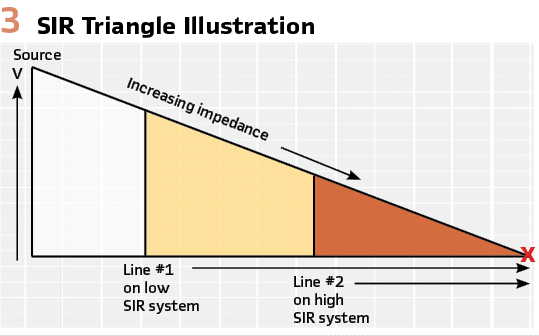
A simple way to visualize the effects of Source Impedance Rato is with a triangle diagram (Figure 3). The hypotenuse represents the total impedance between the source and the fault location (source impedance and the line impedance). As fault current flows through this impedance, the voltage progressively decreases, reaching zero at the fault location shown on the right side of the diagram. In a low-SIR system (Vertical line #1), most of the total impedance is in the faulted line (the portion of the hypotenuse above the yellow and orange sections). As a result, the voltage measured at the remote terminal remains relatively high during the fault. In contrast, for a high-SIR system (Vertical line #2 represented by only the orange section), a much larger portion of the total impedance is contributed by the source system (the portion of the hypotenuse above the white and yellow sections). Consequently, the voltage at the remote terminal is significantly lower during the fault. The combination of lower voltage and lower fault current at the remote end of the faulted line in a high-SIR system reduces the measurements available to protective relays, making the fault distance calculation more sensitive to CT/PT and other measurement errors. For an excellent explanation of high SIR and CVT transient issues, I recommend reading Bogdan Kasztenny’s paper “Security Criterion for Distance Zone 1 Applications in High-SIR Systems With CCVTs.”
OPGW Static Wire Effect on Impedance
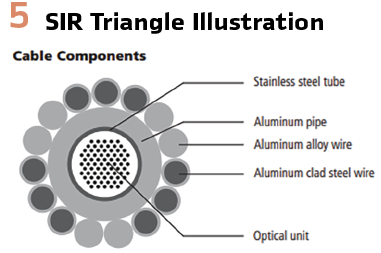
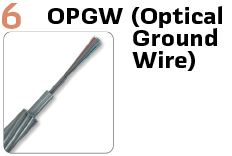
The investigation evaluated whether Optical Ground Wire (OPGW) could have contributed to the overreach. OPGW, which incorporates fiber-optic strands for communication, and replaces traditional steel or galvanized static wires.
At Tampa Electric, OPGW has been installed on many circuits to support high speed protection schemes and other communication needs. However, the impedance calculations used for transmission modeling currently do not incorporate OPGW specific data because the available transmission segment records do not indicate which spans have OPGW.
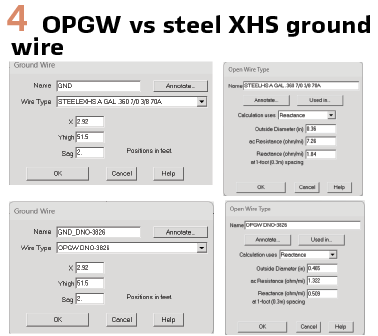
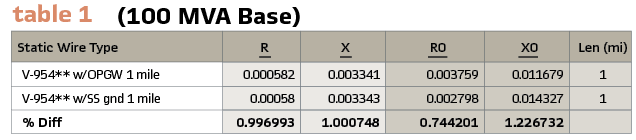
A brief study evaluated the difference that OPGW could make on the calculated impedance. The zero sequence impedance of a one-mile segment of the line’s conductor configuration was computed twice: once assuming OPGW was present and once using traditional steel ground wires.
The analysis showed that the zero-sequence impedance with steel ground wire was approximately 23% higher than with OPGW installed (see calculations below). (The ground wire type had almost no impact on the positive sequence impedance.) Although this difference is significant and could influence ground-fault reach calculations, subsequent investigation found that neither of the two mis-operating circuits had OPGW installed. (Figures 4, 5, 6 and Table 1).
The Process of Determining Mis Operations’ Causes
The process of diagnosing mis-operations follows a structured, iterative approach similar to the scientific method: Observation, question, (research), hypothesis, experiment/test, (analyze) & conclusion; all in repetition until the answer is found. In mis-operation analysis, the hypothesis step is equivalent to “developing a likely reason for the mis-operation” and the experimentation phase involves “evaluating the available data to determine whether the proposed reason is consistent with what actually occurred and explains the mis-operation.” Similarly, the process is repeated until the mis-operation is fully explained. (Figure 7).
In practice, evaluating a new hypothesis often requires gathering additional information and this additional information, such as requesting higher-resolution relay records, verifying field wiring, consulting prints, or reviewing as-built documentation. This new data frequently raises additional questions or reveals new insights that prompt further avenues of investigation.
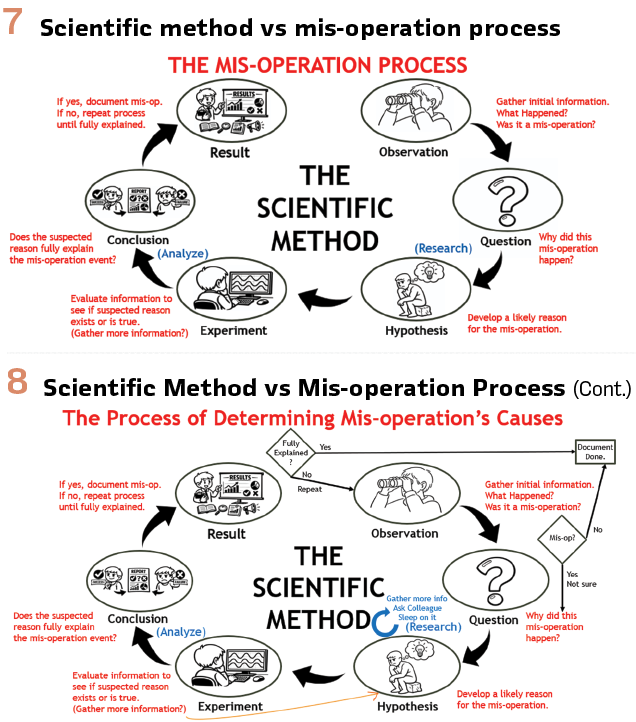
The most likely or easiest-to-test explanations should always be investigated first. If the answer remains elusive, input from colleagues may bring different experiences, familiarity with equipment quirks, or awareness of prior similar incidents. Their input can provide new directions to explore. (Because mis-operations frequently involve multiple factors, it is not unusual for the final explanation to emerge only after several rounds of analysis and possibly discovering that more than one problem or failure was involved.) Stepping away from the problem temporarily can also help, giving engineers a fresh perspective when they return to the investigation. (Figure 8).
List of Possible Mis-operation Causes to Consider
- Equipment Failures:
- Relay Failures/Malfunctions (more common in electro-mechanical relays than microprocessor)
- Failed inputs/outputs
- Breaker failure, failed trip coil, slow CB
- Aux relays (stuck, slow)
- Temperature (overheating)
- Mechanical disturbances (vibrations or accidental bumping)
- Wiring problems (damaged, loose, broken, contamination, water ingress, shorted/grounded, improper grounding, transients, etc., lightning, loss of DC, blown fuse)
- Communication errors/failures (many types of COMM systems, schemes & errors)
Incorrect Settings:
- (Zones/Pickups/Time Dials/CTR/PTR/Logic) (design or As-left personnel errors)
- Insufficient delays, wrong element in TRIP equation (i.e. no time delay)
- Incorrect calculations or data used in calculations (modeling errors, coordination errors)
- Wrong device settings (different device, old, future or test settings)
Human Errors in Field:
- Wiring problems (design, as-built, not built, removed, partially installed/removed protection, temporary changes not fully wired or removed)
- CT/PT Phase rotation wrong. Backward polarity. Wired from wrong CB
- Relay testing (not disconnected or blocked). Test switch/knife blades left open or closed.
- Closed N.O. contacts that open while updating settings or other relay resets (including COMMs)
- COMMs on swapped/wrong channel or other COMM setup issues
- Wrong size wires
Other:
- Mutual coupling
- High SIR (Source Impedance Ratio)
- AC System: CT Saturation / PT transients / Harmonics
- Secondary flashovers
- System oscillations
- In-rush currents/Cold Load pickup
- Neighbor with different phase conventions
- Unexpected system topology (switching)
- Directionality, fault current reversal with other trips
- Unexpected fault type (simultaneous faults, cross-country or evolving faults)
- Transients/Noise on COMMs (Blocks dropping out, spurious DTT picking up)
- DC issues: Loss of DC, Induced voltages, AC on DC, grounds
(Murphy’s law applies: “Anything that can go wrong will go wrong.” Protection systems have many parts. Failure at any point of a protection system will cause some problems.)
Mis-operation Process Take-aways
Most mis-operations stem from a relatively small set of common causes. Because of this, an efficient investigation should begin by evaluating the most frequent and easiest-to-test causes first. Many times, while gathering data for one suspected issue, clues are uncovered that point to a different root cause to investigate. Rare or unconventional causes require more iterations to discover. If the engineer does not remember or is not aware of the possibility of the cause, significant time can be spent testing numerous unrelated possibilities.
When progress stalls, discussing the event with colleagues, particularly those with extensive field or protection experience, often introduces new information, insights or perspectives that can lead to the solution. As with any analytical or creative process, “sleeping on it” and pausing the investigation can help reset thinking and enable fresh insights upon returning.
Specific causes can lead to different types of mis-operations (Failure to trip, slow trip, unnecessary trip). For example, a failed output contact is more likely to cause a failure to trip as compared to an unnecessary trip (unless the output was used for block trip). Taking this into consideration is an example of how understanding protection systems design helps narrow down the likely causes.
Occasionally, what appears to be a mis-operation may actually be the correct response once the full context is understood.
Another important practice is to look for issues during the evaluation of correct operations. Even when a protection system overall performs correctly during an event, hidden problems may be present. Identifying and correcting these issues proactively can prevent future mis-operations.
Technical knowledge, efficiency, curiosity, attention to detail, open collaboration and persistence are key traits that improve successful mis-operation diagnosis. The benefits of diagnosing mis-operations go far beyond simply identifying the immediate cause of failure but is also a tremendous learning opportunity.
Remaining cause of mis-operation found
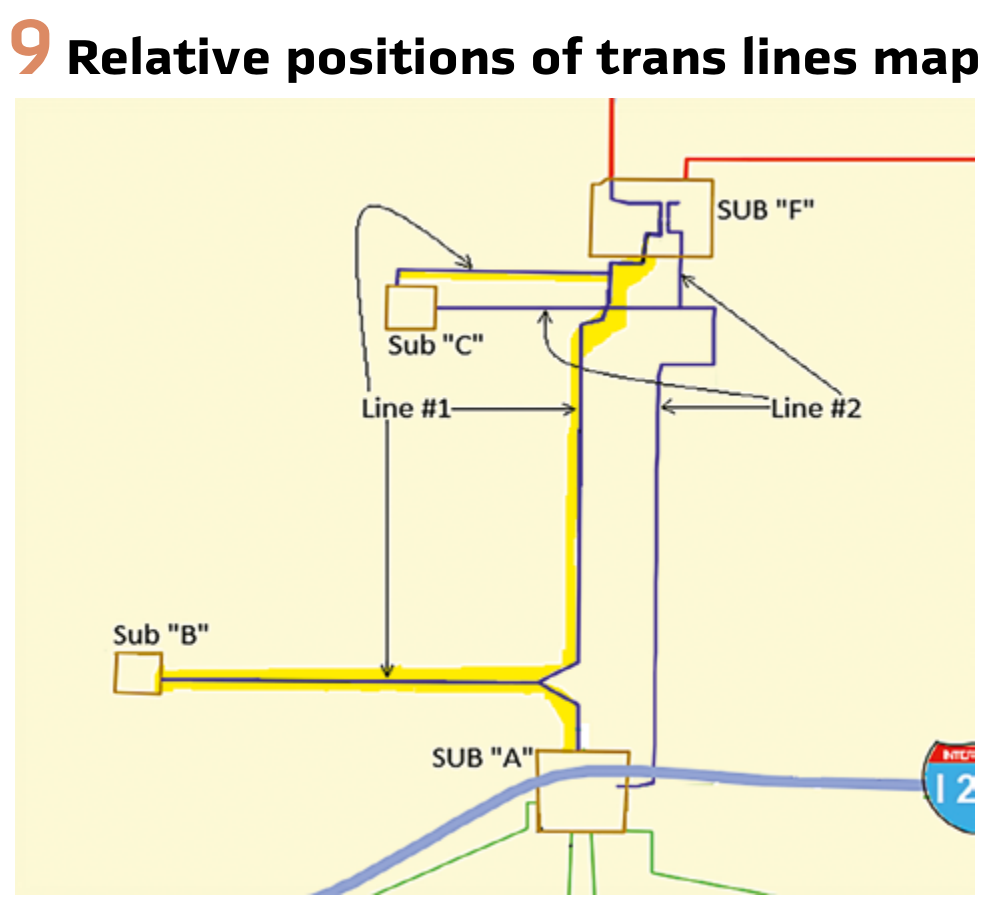
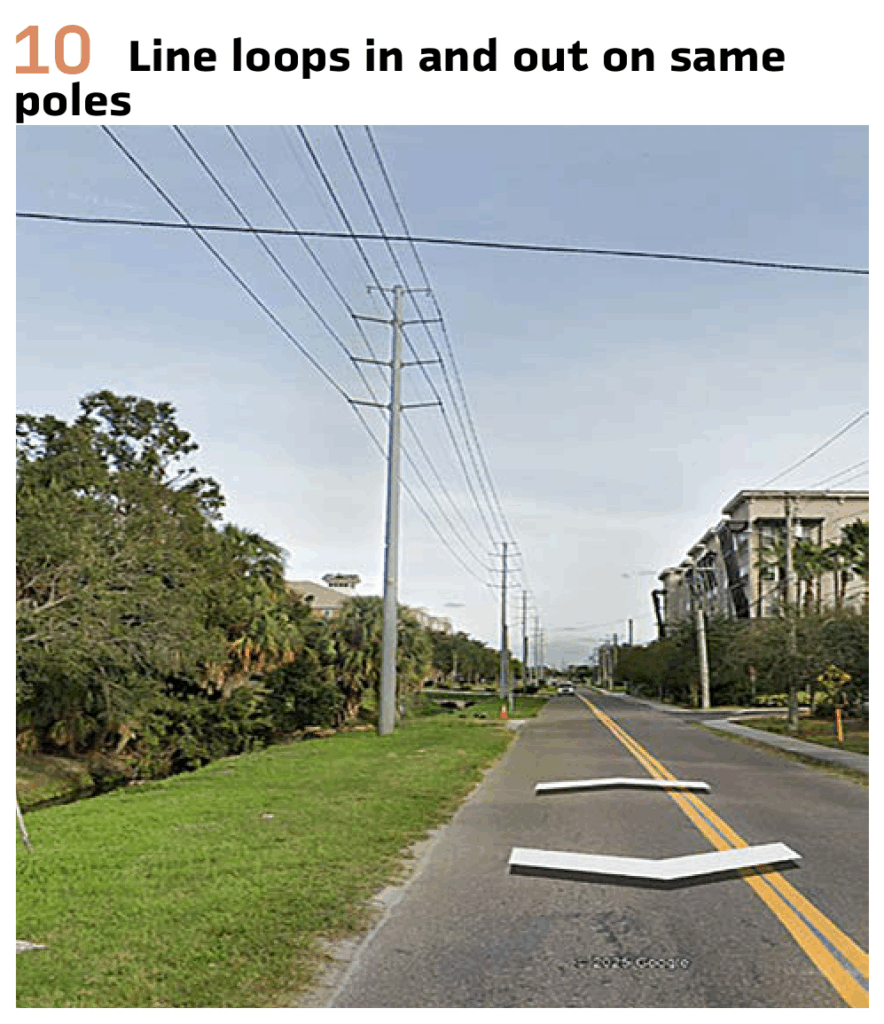
After reviewing many different possible causes for the mis-operation and possible sources of error in the line impedance calculations, the investigation revisited the possibility of line proximity, or mutual coupling effects. (All sources to-date indicated that the lines were not close together.) When a different mapping resource was reviewed (that shows circuits’ relative physical locations on a map), it confirmed that the known parallel segments of the two circuits were not in close proximity but were on opposite sides of a wide street. However, in this resource it appeared that the segments of Line #1 to the tapped load Sub “B” were drawn like a single line tap instead of two separate lines as was modeled. This prompted a closer inspection. Google Maps street view images revealed the two segments to Sub B did not approach the tapped station along distinct routes as modeled. Instead, they looped into and out of the load station “B” on the same poles, for approximately 1.1 miles in each direction – representing roughly 54% of the total 4-mile line length. (This had been modeled incorrectly since the tapped load station “B” had gone in service sixteen years earlier.) (Figure s 9, 10).
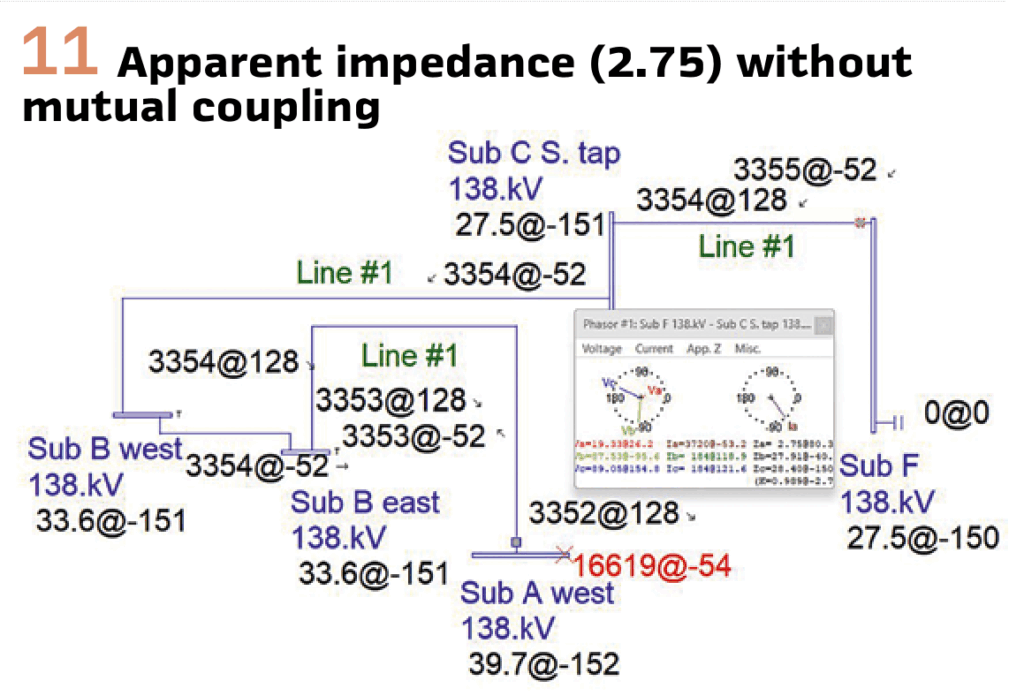
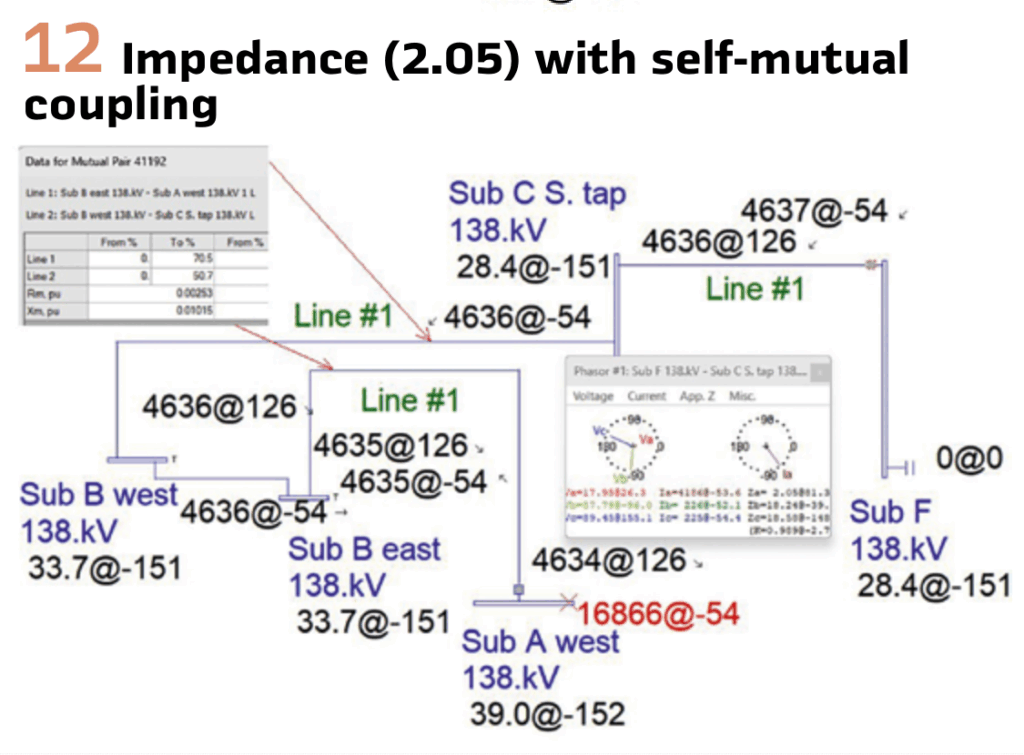
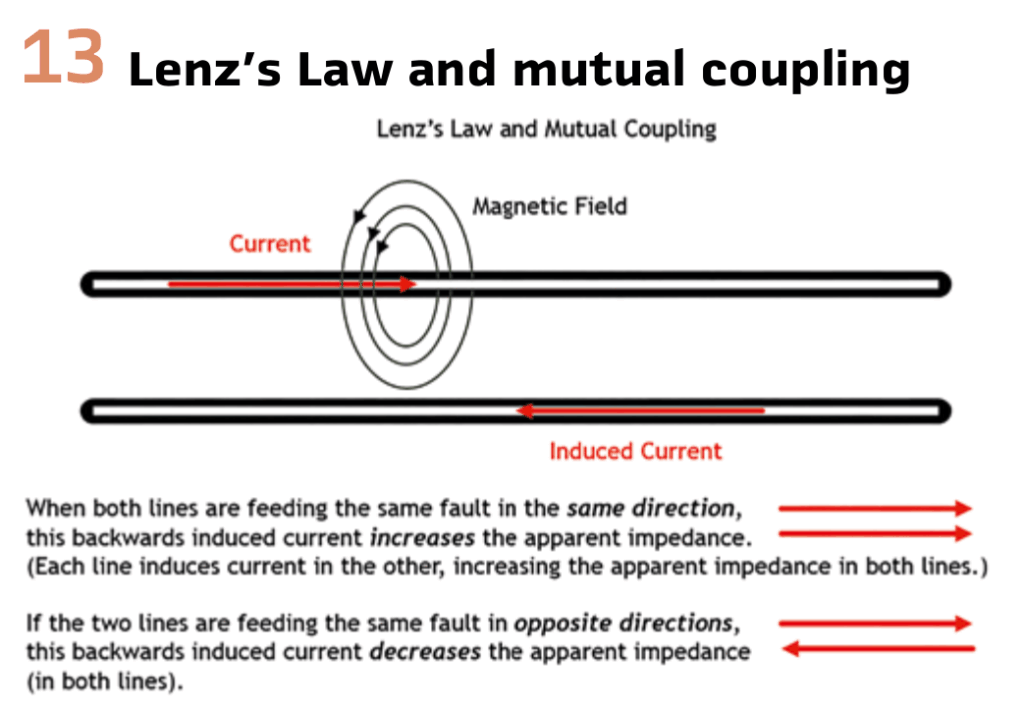
While the transmission department’s conductor/configuration data did indicate that the two 1.1-mile segments shared poles with another circuit, the impedance model only accounted for the presence of adjacent conductors and did not include mutual coupling. (This only affected circuit impedance 0.4% for zero sequence & 0.06% for positive sequence on this line #1.) When mutual coupling is modeled between two independent circuits that do not share common terminals, the impact on apparent impedance is usually minimal. However, in this circuit’s case, the coupling effects are from currents flowing in opposite directions – along adjacent conductors looping into the same Sub B. This configuration creates a condition I’m calling “self-mutual coupling”, where the line’s own return path produced significant coupling effects. Modeling this accurately showed that the apparent impedance of the affected line was reduced by approximately 25%. (For comparison, an extreme case where 100% of the line contains this configuration would result in an apparent impedance reduction of 49.4%.) (Figures 11, 12, 13).
This 25% reduction in apparent impedance from the self-mutual coupling effect and the overreach caused by SIR/CVT transient issues identified earlier explain the total observed 54% apparent impedance overreach at the remote end relays.
As a corrective measure, the zone reach settings for Line #1 were re-coordinated to accommodate both the self-mutual coupling and the SIR/CVT transient behavior. This included setting a no-delay Zone reach of 44.4% and adding second fast Zone with 65% reach and a 2-cycle delay.) (For Line #2 the temporary reduction of Zone 1 65% was deemed to be adequate, as it only had SIR/CVT conditions.)
Conclusion
Each mis-operation investigation not only resolves a specific event but also reinforces knowledge that improves future engineering work. Lessons learned from mis-operation analyses have been some of the most valuable contributors to improved protection settings, modeling practices, investigative skills and motivation to improve.
Biography:

Paul Hodges is a Principal Engineer in the System Security department at Tampa Electric where he has been responsible for relay settings and working to meet NERC standards for 14 years. He has been involved in investigating operations/mis-operations for the last 4 and a half years. Before that he worked in a variety of planning and operations positions at Tampa Electric starting 1988, including System Planning and Operations, Distribution Operations and Substation Operations. He received a BS in Computer Engineering & BA in Mathematics (1990) and a MS in Engineering from the University of South Florida in 2008. He is a P.E. in the state of Florida.