by Theo Laughner, PowerGRID-RX, Sean Murphy, PingThings, and Mohini Bariya, UC Berkley, USA
Utilities are unnecessarily limited by their ability (1) to explore and quickly test hypotheses about data and then (2) to move analytic use cases from prototypes to production in operational systems. This arises because utilities are slow to traverse the analytics pipeline. The analytics pipeline not only supports the implementation of applications for previously identified use cases, but also enables the discovery of new use cases through exploration of the available measurement data. Utilities are tied to legacy platforms, ill equipped for analytics or the traversal of the analytics pipeline and need the right tools to process and analyze time series sensor data at scale.
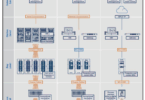
The analytics pipeline (Figure 2) captures a process to realize value from data by the development of analytic use cases. Each element of the pipeline is hampered by traditional utility data systems.
For example, even if the data is captured (Step 0) from the device, access (Step 1) may be limited to very few people or measurements due to storage space or limited network bandwidth. Even data transferred and stored must be verified (Step 3) before analysis is performed, because bad data will yield bad information. Once the data is cleaned, it can finally be used for exploratory research and analysis (Step 4).
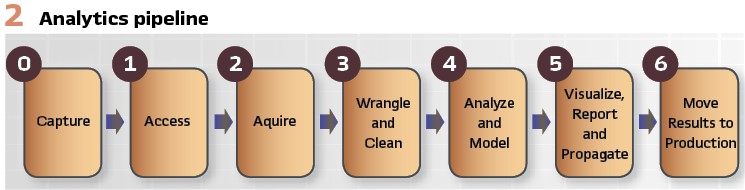
If the results are conclusive, then reporting and visualization take place manually (Step 5) and often with desktop-based tools like MATLAB or Excel. Taking these prototype results and migrating them back to production is nearly impossible (Step 6). In some cases, production rollout of an analytic either never occurs or requires significant development effort.
Next generation sensors are being deployed across the grid at an increasing rate and sensors already embedded in smart assets lay dormant and only require software activation. Still, utility data systems are unable to handle the deluge of data. Moreover, even if such legacy platforms could handle the quantities of data, there are few systems that can make the data available for advanced analytical techniques like machine learning and artificial intelligence. Without known use cases and applications with previously identified return on investment (ROI), utilities are unlikely to adopt modern computational paradigms even though the most capital-intensive part of data acquisition-sensor deployment-has already been completed. Thus, the industry faces the classic chicken and egg scenario: which came first, the data platform or the application?
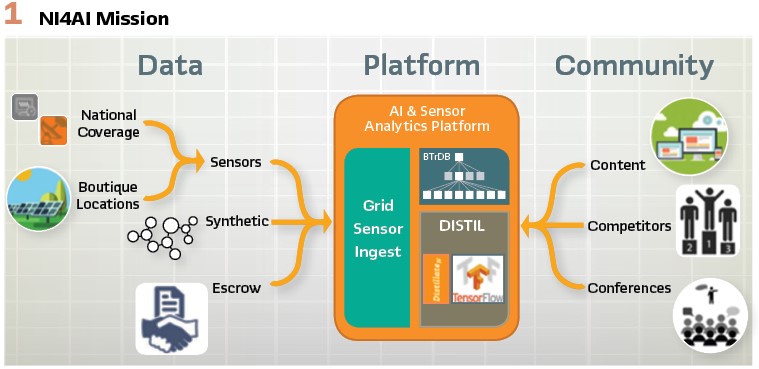
To encourage the utility industry to adopt these techniques, the Advanced Research Projects Agency-Energy (ARPA-E) funded the National Infrastructure for Artificial Intelligence on the Grid. The NI4AI has a 3-fold mission:
1) Deploy and enhance a platform architected to make working with time series data at scale easy
2) Collect and host a variety of data sets to be made available to researchers for developing AI constructs, and finally
3) To build a community around this ecosystem.
The Problem
Surveying the utility landscape, we see an ever-present chasm in the grid analytics space. This gap prevents ideas and hypotheses about how data from grid sensors can create value from being fully developed as prototype use cases and then deployed into production. Currently, at best, these ideas get implemented in MATLAB and run on a laptop, with results potentially presented at conferences or published in journals. However, even successful prototypes that enhance the grid’s stability, resiliency, and/or reliability can take years to be operationally deployed if they ever make it to the production environment.
The slow pace of analytic use case development has allowed high-value data to languish unused at utilities and even to be deleted due to storage space and dated software cost models. This limited use of sensor data inhibits the utility’s ability to push the boundaries of their technical capabilities and gain greater insight into the real-time operation of their networks. For example, phasor measurement capabilities are built into many smart assets such as modern smart relays, consequently, the number of PMUs connected to the grid is already in the hundreds of thousands. Many transmission utilities have dozens, hundreds, or even thousands of PMUs deployed but inactive, lacking the capabilities to leverage the vast data volumes that these sensors generate when operational.
Consider the measurements from a single PMU which could be used to detect voltage sags on a system. Synchrophasor data is perfect for advanced analytics because its intrinsically high sample rate–30 Hz or greater–allows observation of short-duration, sub-second events that span only a few cycles.
However, scanning a year of just a single voltage phasor magnitude signal at 120 Hz requires the processing of 3,784,320,000 data points or approximately 60GB of time series data. Most analytic tools in the utilities’ toolbox are ill-equipped to handle this quantity of data.
The Approach
It is possible to develop and deploy an analytic for grid sensor data in days rather than months or years by walking through the steps taken to achieve these results. The key to such speed is the use of an open, state-of-the-art platform to ingest, store, clean, visualize, and process time series data from such grid sensors such as PMUs, digital fault recorders, point on wave sensors, smart meters, and power quality meters. This universal sensor analytics platform was designed with a deep understanding of the analytics pipeline to allow utilities and other organizations to traverse it at warp speed.
The platform allows authorized utility users to easily access data and enables artificial intelligence and analytics as core components of the platform (instead of bolted on additions), making available best of breed open source data visualization, analysis, and machine learning software libraries.
The paper, A Universal Platform for Utility Sensor Data Analytics and Artificial Intelligence, details this universal sensor analytics platform, describing the underlying technologies and innovations that enable such capabilities.
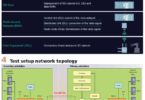
However, even with a platform in place, utilities are often slow to adopt new analytics. Consequently, ARPA-E funded a multi-year project called the National Infrastructure for Artificial Intelligence on the Grid (NI4AI). As shown in Figure 1, the project has a 3-fold mission: develop and deploy a cloud-based platform, host a variety of data sets for researchers to develop new analytics, and build a community around this ecosystem.
In phase one, the NI4AI project aims to deliver a high performance and open platform for sensor data of all kinds. This type of platform is critical, because as new sensors are deployed on the utility infrastructure, being able to readily ingest data from these new sensors will be necessary.
In addition, the ability to couple data from multiple and disparate sensor networks will be essential to making better decisions. An open platform will enable collaboration between multiple organizations and reduce the time required to develop new analytics.
In phase two, the NI4AI project aims to make available a variety of sensor data from both real and synthetic instruments. This data set will capture the multiple aspects of the grid’s behavior. The data set will include wide area, continuous data (like PMU), and boutique data sets targeting grid components of interest (like Power Quality or Protection). The next set of data will be from large grid models which have been instrumented with virtual sensors. The sensors will be incorporated as data upon which analytics can be developed. Finally, in this phase, a data escrow service will be developed to facilitate the exchange of sensor data between utilities and pre-approved organizations. This escrow service will have the ability to clean and obfuscate the data.
In phase three, a structural set of incentives will be developed to motivate both researches and industry practitioners to collaborate. The goal is to remove any and all obstacles to the rapid development, adoption, and deployment of new use cases based on analytics, machine learning, and artificial intelligence on sensor data of the electric grid. Competitions will be hosted to allow researchers to showcase their ideas. Results will be shared at conferences. Finally, an online community will be developed to share and promote ideas using the platform.
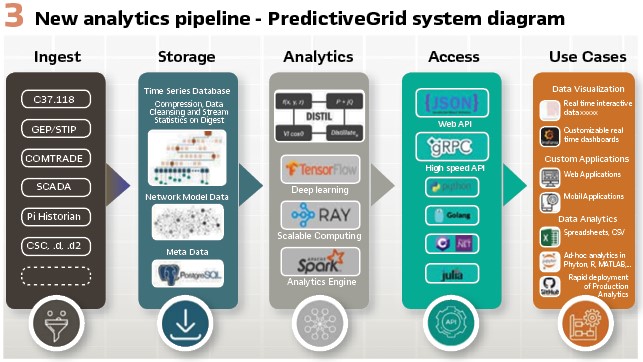
The result of this investment is a new toolset. This toolset creates a new analytics pipeline. The new pipeline integrates data from disparate data and simultaneously promotes not only the rapid development of new analytics, but rapid production deployment. Figure 3 shows the elements of this new analytics pipeline. This new pipeline fundamentally changes the way utilities convert data into actionable information.
Example of Voltage Sag Identification
Analytic development often begins with data exploration, a step whose value is difficult to overemphasize, especially when the user is unfamiliar with the measurement data or the phenomenon of interest. Pervasive sensor data, especially continuous, high frequency measurements of the electric grid, is relatively new, and some sensors, such as distribution synchrophasors (µPMUs), are novel. Many utilities and academic researchers are unfamiliar with the sensor measurements or only have experience with simulated versions different from real data. For example, there is some uncertainty about the meaning of µPMU measurements.
During Transient events such as faults or when the system frequency is not constant, the voltage and current do not follow the perfect sinusoidal model–with a 60 Hz frequency and fixed amplitude and phase. However, the PMU always outputs a magnitude and angle measurement that implicitly assumes this perfect model.
Therefore, the physical interpretation of the returned magnitude and angle measurements can be ambiguous. Voltage sags have a very distinctive appearance in PMU voltage magnitude measurements.
However, users familiar with point-on-wave or lower resolution measurements may not immediately recognize the right metric to isolate these events in PMU magnitude data. Therefore, exploring the data and gaining familiarity with these novel data sets is a vital first step in developing new applications.
The NI4AI enables exploration of high volume, high resolution, multi-modal grid sensor data via rapid data access and interactive, multi-stream visualization across time scales. Given this capability, voltage sags can be identified at the lowest temporal resolution, where months or years of data are visible (top panel, Figure 4).
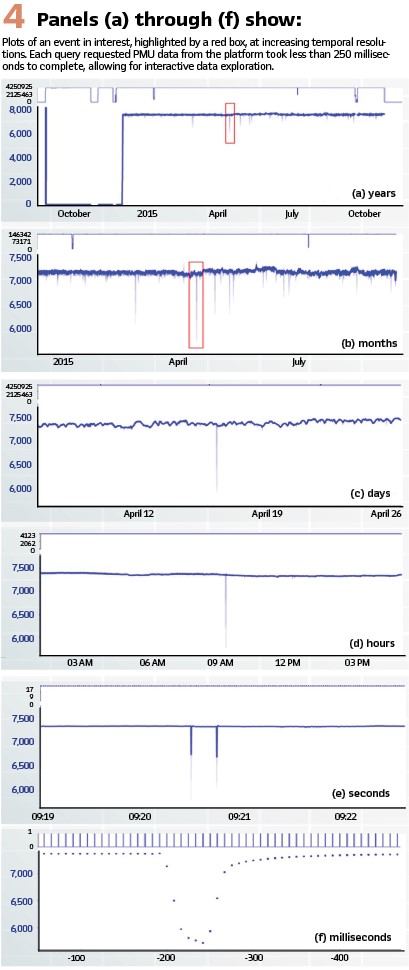
The visualization not only shows the average value for the time period represented by a single pixel column but also shows the minimum and maximum values as a shaded region. Thus, even at this resolution, voltage decreases are visible as fine spikes.
Traversing the panels in Figure 4 from top to bottom, each shows an increased level of “zoom” or finer temporal resolution and required a separate query of the platform. Each query completed in less than 200 milliseconds making truly interactive data exploration possible. With the platform, the user can select an area of interest, shown in red, and smoothly zoom in to resolve individual 120Hz measurements.
At this level of zoom, the exact shape of the transient voltage decrease is evident. After examining numerous such events, the user is armed with intuition for what makes these events unique and can start to prototype a potential detection approach.
The general approach to voltage sag detection is to compute a metric on a window of data that indicates the presence of a voltage sag. Based on the data exploration step, the voltage sag’s shape suggests several potential metrics.
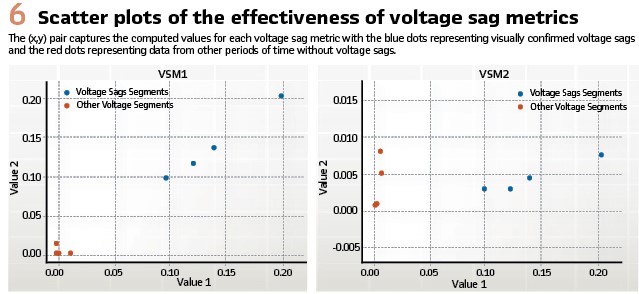
- The first possibility, Voltage Sag Metric 1 or VSM-1, finds the minimum value within the signal segment and computes the differences between this minimum value and the measurements shortly preceding and following it (both differences are expected to be large)
- The second possibility, VSM-2, calculates the difference between the window’s mean and minimum (expected to be large) and the difference between the window’s maximum and mean (expected to be small). Metric two ensures that the voltage sag consists of a narrow spike that drops significantly below an otherwise predominantly flat signal
Using the Python API, test segments of data that include voltage drops as well as other notable changes that are not voltage drops found via data exploration are pulled into the Jupyter Notebook
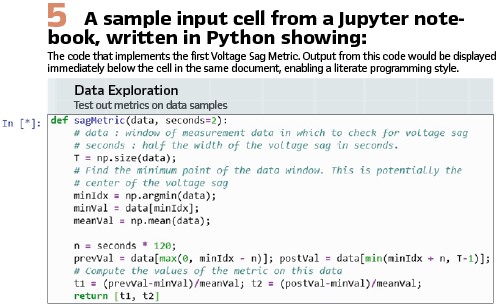
- Next, the two proposed voltage sag metrics are computed over the samples to get a sense of their efficacy. The implementation of the first metric in the notebook is shown in Figure 5. Each proposed metric consists of two values and can be quickly evaluated using a scatter plot Figure 6. This preliminary result suggests that both metrics are effective for detecting voltage sags
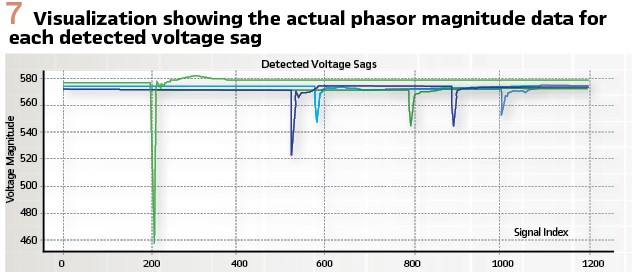
- After verifying the promise of the two approaches on a few samples, the speed of the platform enables testing over a much larger data set before being deployed to production. VSM-1 requires scanning through all of the data, querying the database for full resolution measurements (120Hz). Implementing this is as simple as putting our scripts from the exploratory phase into a for loop. Over one day of voltage magnitude measurements, the first approach runs in 23 minutes or 63x real time. The algorithm detected six suspected voltage sags
Metric two can be similarly implemented by querying the data at full resolution within a for loop. However, the formulation of the metric allows us to leverage an important aspect of the platform to achieve even faster performance. In addition to raw values, the universal sensor platform stores summary statistics at the internal nodes of its tree structure. At a particular internal node, the summary statistics consist of the mean, minimum, and maximum over all values “below” that node.
These summary statistics can be queried more rapidly than the raw values. Since metric two is defined only in terms of the mean, minimum, and maximum over a window, we can compute it by querying the summary statistics for the window. Over the same day of voltage magnitude measurements, the approach runs in 1.28 seconds or 67750x real time. This algorithm detected the same six suspected voltage sags as VSM-1.
In this test case, the two approaches have dramatically different runtimes but detect the same events. This may not always be the case and using summary statistics inherently limits the range of analytics possible compared to using the raw, full resolution data.
However, as this example demonstrates, the power of the platform is that both approaches can be prototyped and tested rapidly so the appropriate tradeoffs between speed and accuracy can be chosen. (Figure 7).
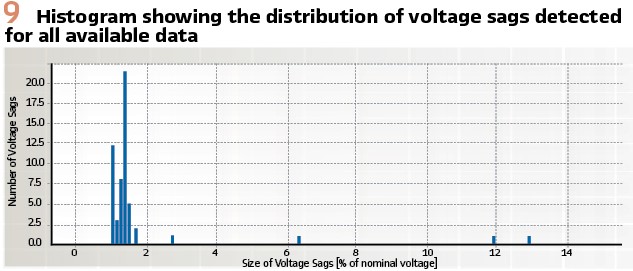
Based on the visualization in Figure 6, the detected voltage sags are indeed real voltage sags with a distinctive and consistent shape, validating this metric for a larger sample of data. Additional analyses can be easily visualized to offer more insights into the voltage sags and the event detection approach. A heat map (Figure 8) indicates the sensor locations where voltage sags occur over a month and a histogram (Figure 9) demonstrates the size distribution of the sags.
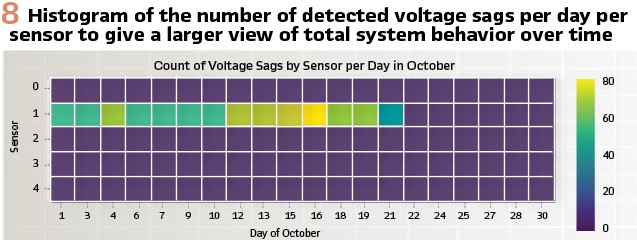
From the heatmap, we see that sensor 1 captures many voltage sags throughout the first part of the month. This may indicate the presence of a periodic load near that particular PMU which becomes inactive during the second part of the month.
Conclusion
Utilities are dramatically limited in their ability both to test hypotheses and use cases leveraging data and to move prototype analytics into full deployment in production systems. To show that the status quo is not some fundamental limitation, this paper demonstrates not only the rapid development of a use case of interests using high density PMU data, but also the deployment of this use case to a production big data system with operational data. This rapid traversal of the analytics pipeline was made possible through the use of the NI4AI.
To learn more, visit the National Infrastructure for Artificial Intelligence website:
Biographies:
Theo Laughner has nearly two decades experience at the Tennessee Valley Authority managing over 1900 power quality monitors, digital fault recorders, microprocessor relays, and revenue meters, integrating this data into an enterprise utility data system, and automating the retrieval of this data. He has years of experience engaging with utilities and researchers via CIGRE, EPRI, and IEEE.
Sean Patrick Murphy is the CEO of PingThings, Inc., creators of the world’s fastest time series data management, analytics, and AI platform. PingThings is his fourth company. Previously, he served as a senior scientist at the JHU Applied Physics Laboratory for over a decade, where he focused on machine learning, high-performance and cloud-based computing, and anomaly detection. He has degrees in Mathematics (UMCP), electrical engineering (UMCP), biomedical engineering (JHU), and business (Oxford), all with high honors or distinction.
Mohini Bariya is a graduate student at the University of California Berkeley in the Electrical Engineering & Computer Sciences department. Her research interests include the electric Grid, Energy, Smart Grid, data analytics, and synchrophasors.