By Adriano Pires, Annelise Bittencourt, Igor Cruz, BR, Brazil, and Rich Hunt, GE Grid Automation, USA
Utilities are continuously looking for improvements in grid reliability: for example, finding ways to quickly detect and fix problems, reduce truck-rolls, increase asset lifecycle, improve power quality, analyze and fix root causes of failures by using operational and non-operational data.
Among these methods event analysis is highlighted as one of the tools to solve a common problem on the power system: gathering and recording enough evidence to perform this forensic investigation to understand and explain how systems and devices, such as protection relays and circuit breakers, behave during unwanted conditions like short circuits.
There is a continuous cycle in terms of event recording, based on the need and desire to capture data for forensic analysis, and the capabilities of available technology to provide this data. As the value of this nonoperational data becomes clear, and as available technology becomes more powerful, more data and types of data can be acquired. This cycle has seen event recording move from simple annunciator flags to transient fault recorders (TFRs) to modern digital fault recorders (DFRs).
The value of this data is such that several countries have a minimum set of requirements defining overall characteristics for fault recording systems. For example, in North America, with NERC PRC-002-2, there are definitions on pre-fault and post-fault time for event analysis, sequence of events recording, disturbance recording, minimum sampling rate, basic triggering conditions and record storage policies. In other countries, like Brazil, the national operator went further by also standardizing the use of synchrophasors, incorporated these measurements into fault recording.
The next steps in this continuous cycle of evolution for recording are being driven by more than just the needs of protection and control. Large scale inverter-based resources and the resulting networks with less inertia, more and more rapid frequency excursions, and tighter system stability limits have system operations groups looking for high resolution data to understand power system behavior in more detail. Examples of new requirements are the ability to capture IEC 61000-4-30 Power Quality class A compliant data, Continuous Point on Wave (CPOW) data; and traveling wave data from faults. And technology is part of the cycle. The adoption of IEC 61850 communications makes data acquisition and processing more robust and more flexible and provides for entire system of fault recording beyond traditional DFR-type devices.
Steps on the Path
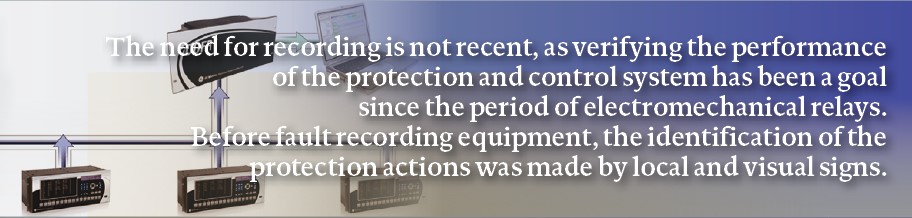
Today, the importance of fault recording equipment in verifying the correct functioning of protection and control systems is evident, as well as aiding in the analysis of system disturbances or any other operation or event in the electrical system. The need for recording is not recent, as verifying the performance of the protection and control system has been a goal since the period of electromechanical relays. Before fault recording equipment, the identification of the protection actions was made by local and visual signs (flags, lamps, etc.). Analysis of some faults were also performed based on visual and local analysis of performance indications, such as evidence of damage caused to the electrical system. These observations and analysis were essential to determine whether the protection system devices worked. The limitation of this approach is obvious, as the only indications were of protection element performance operation (or non-operation), but with no power system data captured to prove these elements were correct to operate, or that other devices were correct to not operate.
First Transient Fault Recorders
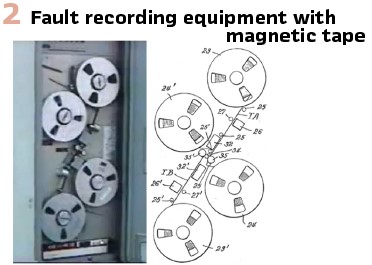
The need to prove the performance of the protection system has driven the ability to record currents and voltages during the transient conditions of fault events. This first transient fault recording equipment was based on the analog technology available. Developed around the 1950s, oscillographic recording was performed by electromechanical equipment that registered oscillations on a moving paper roll using a mobile needle. In the 1970s, the oscillography record started to be on photosensitive papers. Records had to be manually retrieved, and some of these records could take days to be available for analysis. Another negative point in the case of photosensitive papers is that some records were lost over time and could not be used for further comparative analysis. Overall, the recording process was not reliable, and this became a problem for the effective use of these records in power system disturbance analysis. The next advance was continuous monitoring with magnetic tape recorders as in Figure 2 for long duration events (hours) and power swings along with data recovery with playback on photosensitive paper.
Magnetic tape also increased the ability to capture transient fault conditions. Magnetic tape has the same limitations as paper recording of retrieval of records and long-term storage. Another limitation of these TFRs was the very small number of analog channels monitored. For this reason, only a very small section of the power system focused on critical elements was monitored. This limited information led to difficulties for the performing of comprehensive power system disturbance analysis.
First Digital Fault Recorders
The first true DFRs using microprocessor technology became available in the mid-1980s. DFRs directly address the limitations of the early TFRs. DFRs make it possible to monitor a large number of analog channels. DFRs also brought benefits beyond transient recording, specifically around data retrieval, as fault records stored as digital data files can be accessed via communication links to automatically send to remote operational centers and engineering offices immediately after a disturbance.
The first fault records generated by microprocessor equipment used proprietary formats, that is, each manufacturer recorded and stored data in a different way. Therefore, the records could only be viewed in proprietary software. A company that had more than one DFR manufacturer on its system would need different tools to view and analyze the fault records. Moreover, when these records were sent to outside organizations like network system operators, these outside organizations also had difficulty performing systemic fault analysis and applying these various formats in computational tools for automatic fault analysis that were already being developed and studied.
The solution to this limitation was the development of the COMTRADE standard. COMTRADE standardizes the record format and thus ensures interoperability between the tools for viewing records, as well as encouraging the development of automatic fault analysis tools; and even tools for predictive and preventive analysis to systems monitored by DFRs.
DFR as Understood Today
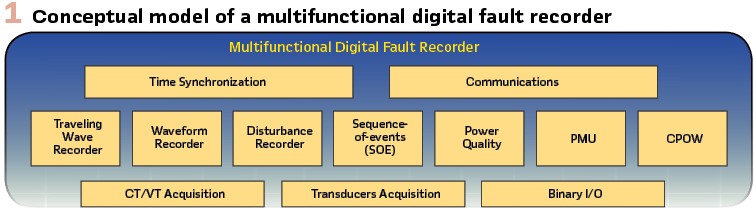
DFRs started as TFRs moved on to microprocessor-based hardware, and quickly added sequence of events recording. Since a DFR is connected to measurements across a substation, it was quickly obvious that more could be done for event analysis. As microprocessor technology and data storage technology improved, the DFR evolved into a more powerful device. DFRs today not only measure and record analog and digital measurements, but also monitor and store calculated values, such as power and impedance among others. Thus, the DFR has become a more multifunctional and complex piece of equipment over time. Its architecture over the decades went from some sensors, needles and paper to a complex architecture of subsystems and subfunctions.
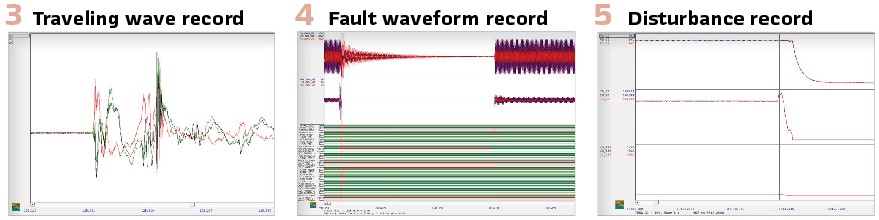
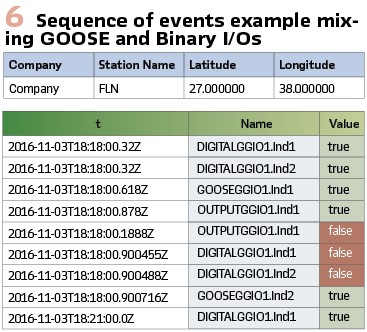
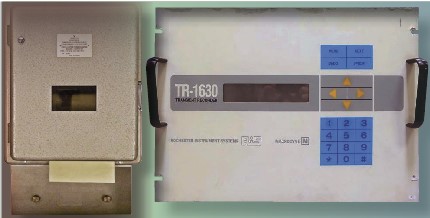
A modern multifunction DFR, like that of Figure 1, combines much functionality in one device. It is a waveform recorder (capturing current and voltage samples at 64 – 512 samples per cycles), a sequence of events recorder, and a disturbance recorder (capturing phasor data once per cycle). It is built on a hardware platform that acquires analog measurements such as current and voltage, transducer measurements, the status of contact IO, all tightly time synchronized, with significant file storage and support for modern SCADA communications. Recent requirements for DFRs include publishing synchrophasor data and the ability to act as a PMU, as well as capturing power quality data for high resolution analysis of system disturbances, especially voltage profiles. So, the modern DFR provides data like the Traveling Wave recording of Figure 3, Waveform recording of Figure 4, the disturbance recording of Figure 5, and the sequence of events recording of Figure 6.
As the hardware for DFRs have improved, the tools for fault analysis have also seen increasing requirements and increasing capabilities, with a goal of automatic fault analysis as much as practical. This subject, Automatic Fault Analysis Tools, has evolved the most in the last few decades. The application of computational tools in the automatic fault analysis has as its main objectives the reduction of the time spent by the analytical engineers to perform a fault analysis as well as the time in which a certain component of the power system remains out of operation.
Architectures to Manage Requirements
The challenge that is introduced by these increasing requirements for DFRs is that of the complexity and cost of installation. There are several architectures for DFR installations that have developed over the years to manage this challenge of installation.
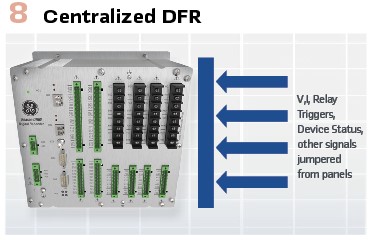
- Centralized DFR: All data is analog data, directly wired between the primary and secondary equipment sources of the data, and the DFR itself. Every recording channel therefore requires a pair of copper wires, connected from the primary equipment. Centralized DFR records capture all channels simultaneously, in a common format, with a common sampling rate. This makes this architecture very suitable for smaller to medium substations or where the utility wants to segregate the analysis of bays across the substation. (Figure 8).
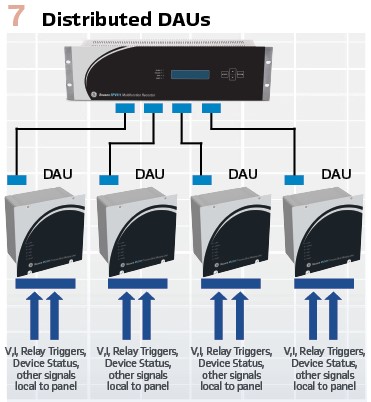
- Distributed DAUs: All analog/digital signal is installed closer to the source of the signals through DAU (data acquisition units). The data are sent back to the main DFR through some form of communications. DAUs may be installed anywhere, but are most typically installed in protective relay panels, because most signals are already wired to these relay panels. The communications between the DAUs and the DFR is normally proprietary to the equipment vendor, with DAUs. and the DFR acting as a closed system. This slightly simplifies installation over the centralized DFR while still providing common triggering and recording; and is ideal for installation in larger transmission substations and substation expansion projects. (Figure 7).
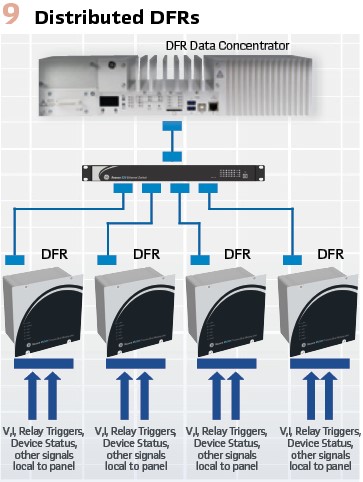
- Distributed DFRs: This concept extends that of the DAU, to turn the DAU into an individual DFR, with a DFR installed in every relay panel. A dedicated DFR data concentrator is then used to collect and synchronize the records from individual DFRs, and for bulk record storage. Each one of these DFRs is an individual DFR, with the general capabilities of a larger DFR. This is also a good solution for large transmission substations and expansion projects. (Figure 9).
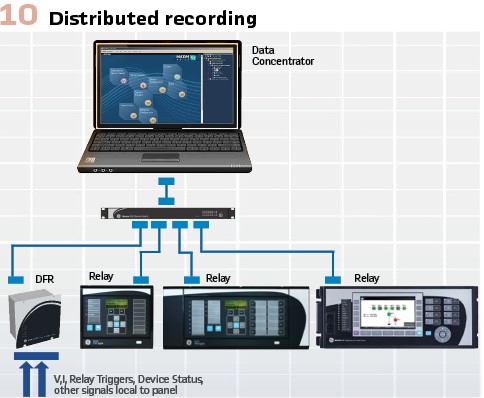
- Distributed recording: Microprocessor-based protective relays include the ability to capture waveforms and sequence of events logs and may include the ability to capture disturbance data. Distributed recording then uses individual protective relays and recording meters to trigger and capture recordings. A centralized device or software then retrieves these recordings, coordinates and synchronizes recordings captured for the same power system event, and stores the data. In essence, this becomes a distributed recording system. This is the most cost-effective method to provide recording in substations and seems to be simply another form of the distributed DFR architecture, where DFR functionality has converged into protective relays.
It is important to understand that relays do not provide full DFR functionality. A true DFR uses quantity-based, not element operation-based, triggers; captures raw unprocessed data at a higher sampling rate than relays; supports longer records; performs continuous recording of disturbance data; and stores large amounts of records. It is also the case that most relays use frequency tracking, so power swings and oscillations where the frequency is changing can often be most faithfully recorded by a DFR with a fixed (non-tracking) sampling interval. Separate DFRs will be needed for a true recording system until these limitations of protective relays are addressed. (Figure 10).
Newer Requirements
As per Figure 1, there are two relatively new requirements that are commonly available in modern DFRs. The first of these is the ability to act as a PMU, providing and streaming synchrophasor data. Since DFRs may be connected to a multiple current and voltage circuits, a DFR can stream synchrophasor measurements for multiple transmission lines and buses. DFRs can also trigger recordings of synchrophasor data for later analysis of specific events. The other requirement is to use the DFR as a power quality recorder. With a high enough sampling rate, such as 256 samples per cycle, DFRs can meet IEC 61000-4-30 Class A requirements for power quality recording, providing useful data for identifying and analyzing voltage excursions on the power system.
Next steps in the evolution
The next challenge for power system analysis is the need to be able to capture and explain the impact of inverter-based resources on the power system. This requires capturing analog measurements at a very high sampling rate. This challenge drives the technology need to integrate this kind of recording in a robust, cost effective manner, continuing the cycle evolution.
High Frequency Sampling
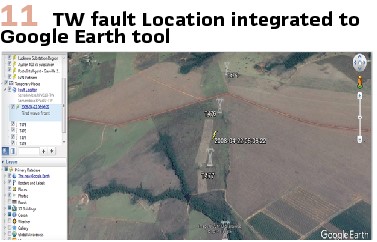
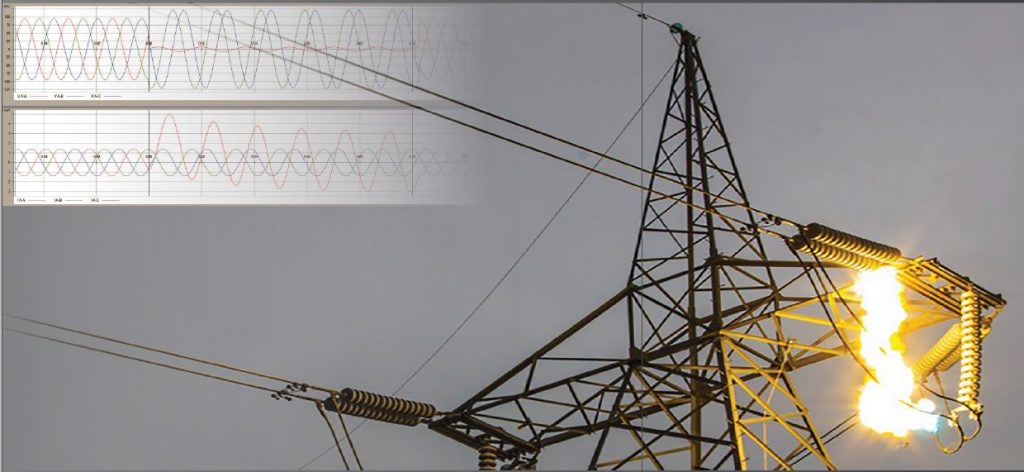
There are two recording concepts that can meet the challenge for high speed recording of data. The first is based on TWFL. TWFL technology uses current and voltage data sampled at very high frequency (typically over 1 MHz sampling rate) to identify the arrival of traveling waves at the measurement location to determine fault location with high accuracy, allowing to map where the event happened in one tower span, as in the example on Figure 11. Fault location compares only the time stamps of traveling wave arrivals, but the actual sampled data can be captured and used to illustrate and analyze the behavior of the power system during fault events, like in Figure 3, or in other power system disturbances where traveling waves are generated. TWFL is not a new technology and recording of this data has been available in DFRs for over 10 years and has been used to capture and analyze faults on both AC and DC transmission lines.
CPOW is the concept of performing continuous capture of current and voltage data sampled at very high frequency, with sampling rates in the 10 kHz to 10 MHz range. The sampling rate is similar to TW data, but CPOW data is continuously stored and captured much like traditional disturbance recording.
IEC 61850 and digital substations (DSS)
Adding new functionality to recording systems, such as TW and CPOW, results in questions about how to implement this functionality cost effectively across an entire system. This is precisely what the IEC 61850 Standard for communications in a substation is intended for. The functional modeling and data sharing of IEC 61850, along with the concept of process bus, (sharing of sampled values (SV) of analog measurements and equipment status between devices) provides for great flexibility in the design in realization of recording systems.
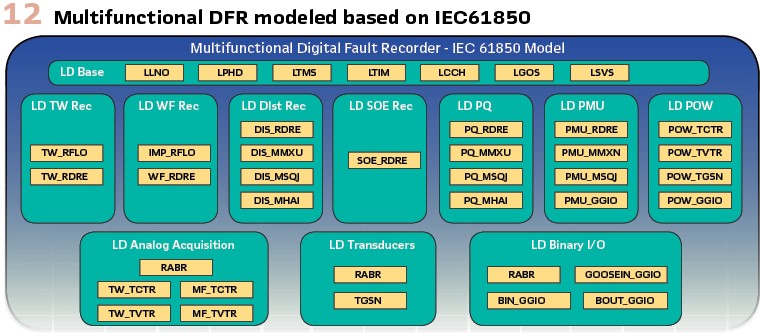
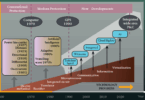
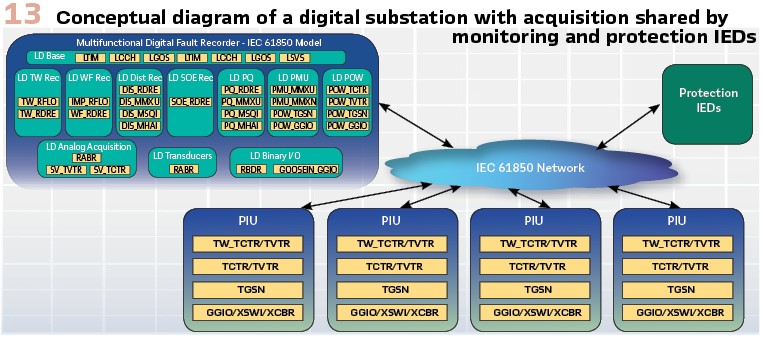
To see this, IEC 61850 models the DFR of Figure 1, as a set of logical nodes (LN) organized by logical devices (LD) as in Figure 12. Each recording application is modeled by a specific Logical Device with dedicated Logical Nodes for each needed function. Prefixes make explicit the specialization of each LN. For example, the RDRE models recorder functions in general and in this model TW_RDRE, WF_RDRE, DIS_RDRE, SOE_RDRE and PQ_RDRE represents respectively the traveling wave recorder, waveform recorder, disturbance recorder, Sequence of Events Recorder and Power Quality Recorder. In concept, each functionality is modeled as a separate virtual device. More advantageously for fault recording system, IEC 61850 enables the concept of a digital substation, with process bus as the link between primary equipment and intelligent devices that process data. A general architecture uses Processes Interface Units (PIUs) as dedicated devices placed in the switchyard at primary equipment, acquiring analog CT/VT signals, transducers data, and binary inputs. PIUs share this data with multiple IEDs, including the DFR, through the process bus network. The functional model of the DFR performs the same applications, but now shares the data acquisition with the protection and control system, as represented in Figure 13 and Figure 14.
The modularity provided by LDs and LNs allows an architecture where there are specialized IEDs based not just on the application, but also on other parameters like design complexity, maintenance and cost.
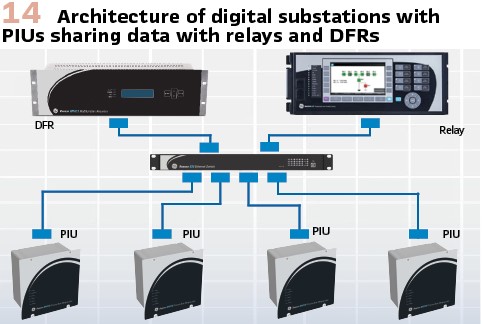
The architecture of Figure 14, for example, places the data acquisition functions, including TW, in the PIUs. As a result, there is no sophisticated processing required in the PIUs. The data is available for use by any device on this network. The more complex functions that manipulate the data, like triggering, recording, storage, and calculations will remain in intelligent devices like a DFR.
This modularity of functions allows other interesting features, such as separating calculated measurements from communication. Synchrophasors that are defined by the PMU_MMXU logical node can be streamed using IEEE C37.118.2-2011 or Routable Sampled Values (R-SV) and can even be recorded by the DIS_RDRE.
In the context of the Digital Substation, it is expected that the requirements for fault recorders evolves by changing its concept from a specific device to a system composed of several applications, devices and architectures, where a decentralized acquisition is placed in the process level with PIUs sharing data to be consumed in the station level by logical devices grouped in IEDs with enough memory, processing and communication capabilities to host those functions. As shown in this article, the recent changes in the electrical system with the aggregation of non-linear loads and renewables power sources is driving grid requirements and technologies to evolve towards a path of more data, similarly to other industries, including higher sampling rates, resolution, accuracy and data processing as source for several applications, allowing utilities to have valuable information to analyze complex events and optimize their systems, and providing to the end-user the overall advantages of a more reliable and connected grid.
Biographies:
Adriano Oliveira Pires Is currently Product Manager of DFRs and PIUs for GE Grid Automation and works in these product lines since 2012, starting at Reason Tecnologia S.A., in Florianopolis, Brazil. He graduated in Electrical Engineering from the State University of Santa Catarina and has his master’s degree from the Federal University of Santa Catarina (2017).
Annelise Anderson Bittencourt is Lead Technical Application Engineer of Reason Product Line for GE Grid Automation and works with this product line since 2009, starting in Reason Tecnologia, in Florianopolis, Brazil. She graduated in Electrical Engineering (2007) and has her master’s degree (2011), both from the Federal University of Santa Catarina.
Igor Cruz is R&D Leader of DFRs, PIUs, Switches and Clocks for GE Grid Automation and has been working in these product lines since 2012 where he held multiple positions leading the execution of programs for Reason Product Line. Igor holds a Bachelor of Science in engineering with focus in computing and substation modernization by the State University of Western Parana.
Rich Hunt is a Senior Product Manager with GE, with 30 years’ experience in the electric power industry. Rich earned the BSEE and MSEE from Virginia Tech, is a Senior Member of IEEE, a member of the IEEE Power System Relaying Committee, the CIGRE B5 Study Committee, and is a Professional Engineer.